
Compare stocks by triangulating three approaches: discounted cash flow (DCF) for intrinsic value, comparable company analysis for relative pricing, and a handful of key multiples for a quick sanity check. Use the dividend discount model (DDM) only when a company pays a stable, growing dividend. No single method is reliable alone, so run at least two, follow a consistent checklist, and treat disagreement between them as a signal to dig deeper, not a coin flip to ignore.
TL;DR:
- Relative valuation using multiples like P/E, P/B, and EV/EBITDA is faster but depends heavily on pairing with a well-chosen peer group; absolute methods like DCF require careful assumptions and sensitivity testing.
- Use the dividend discount model only for mature, dividend-paying companies with stable payout policies; it produces conservative estimates for slow growers and nonsensical ones for non-dividend payers.
- Building an appropriate peer group demands matching industry, size, stage of growth, and capital structure, avoiding sector or size mismatches that lead to misleading comparisons.
- Combining valuation metrics with multi-year trend analysis and normalization prevents common mistakes such as relying on snapshot data or comparing sectors directly.
- Automated tools that score profitability, valuation, and financial health can streamline comparison work, but should supplement, not replace, your own detailed analysis.
Table of Contents
- Absolute vs Relative Valuation: Which Stock Comparison Method Fits?
- How Do You Run a Discounted Cash Flow Analysis?
- When Should You Use the Dividend Discount Model?
- How Do You Build a Peer Group for Comparable Company Analysis?
- What Do P/E, P/B, EV/EBITDA, P/S, and PEG Actually Tell You?
- How Do You Compare Two or More Stocks Side by Side?
- Common Pitfalls in Stock Comparison and How to Avoid Them
- How Does Oracle Investments Apply These Comparison Methods?
- How Should You Choose a Valuation Method for Your Goal?
- Try Oracle Investments for Instant Stock Comparisons
- Sources
- FAQ
Absolute vs Relative Valuation: Which Stock Comparison Method Fits?
Every stock valuation method falls into one of two camps. Absolute valuation tries to calculate what a company is actually worth, independent of what the market thinks. Relative valuation asks what a company is worth compared to its peers, using multiples like P/E or EV/EBITDA as shorthand.
DCF and DDM are absolute methods. They build a value from scratch using cash flow projections and a discount rate, which means the output is only as good as your assumptions. Comparable company analysis and multiples are relative methods. They borrow the market's own pricing logic and apply it to a similar business, which is faster but inherits any mispricing in the peer group itself.
Academic valuation notes from Kellogg's Aswath Damodaran-adjacent research frame this split around one core driver: expected earnings growth. That's what really separates a cheap stock from a value trap.
A quick way to decide which method to lean on:
- Stable dividend payers (utilities, mature consumer staples): DDM plus a sanity-check DCF.
- High-growth companies: DCF with heavy sensitivity testing, since near-term cash flows tell you little.
- Cyclical businesses: normalize earnings across a full cycle before running either method, and lean harder on comps.
- Early-stage or pre-profit companies: relative valuation using revenue multiples (P/S) is often the only workable option, since cash flows are negative or unpredictable.
Neither camp wins outright. Absolute methods are precise but fragile to bad assumptions. Relative methods are quick but only as good as the peer group you pick.
How Do You Run a Discounted Cash Flow Analysis?
A DCF estimates a stock's intrinsic value by projecting future free cash flow and discounting it back to today's dollars. It's the most rigorous of the stock valuation methods, and also the easiest to get wrong if you don't stress-test your inputs.
Here's a simplified version you can build in a spreadsheet:
- Project free cash flow for 5 to 10 years, starting from revenue growth assumptions and operating margins.
- Pick a discount rate, typically the weighted average cost of capital (WACC), which reflects the riskiness of the business.
- Calculate a terminal value for cash flows beyond your forecast window, usually with a perpetuity growth formula.
- Discount everything back to present value and sum it up.
- Divide by shares outstanding to get a per-share fair value estimate.
For raw inputs, pull historical free cash flow and revenue trends straight from a company's 10-K and 10-Q filings rather than trusting a single data provider's recalculated numbers, since accounting treatments and refresh timing vary across platforms, according to StockEducation's comparison methodology. For capital-intensive businesses, owner earnings (net income adjusted for maintenance capital spending) often gives a cleaner input than reported net income, since it strips out accounting noise that distorts true cash generation.
Statistic callout: A basic DCF sensitivity table, testing just two variables (revenue growth and discount rate) across a 3x3 grid, is often enough to show a beginner how fragile a "precise" fair value estimate really is. That's not a flaw in the method. It's the entire point of running a sensitivity check before you trust the number.
Rerun it with more conservative growth and a higher discount rate. If the stock still looks cheap under pessimistic assumptions, that's a much stronger signal than one lucky base case.
When Should You Use the Dividend Discount Model?
The dividend discount model works best for one specific case: mature, dividend-paying companies with a long track record of stable or growing payouts. Trying to apply it to a growth stock that reinvests everything and pays no dividend is a wasted exercise.
The simplest version, the Gordon Growth Model, values a stock as:
Fair Value = Next Year's Expected Dividend ÷ (Required Rate of Return − Dividend Growth Rate)
To use it responsibly:
- Estimate a sustainable payout ratio, not just last year's dividend, since a payout ratio above 80% often signals limited room for future increases.
- Use a realistic long-term growth rate, generally below the overall economy's growth rate. Assuming a dividend grows 8% a year forever will produce a wildly inflated fair value.
- Cross-check the result against a DCF and against dividend-focused peers using a dividend yield comparison, since DDM alone can miss shifts in payout policy.
DDM tends to produce a tighter, more conservative estimate than DCF for slow-growing companies, and a nonsensical one for anything else. That's a feature, not a bug. It tells you the model only belongs in your toolkit for a specific type of stock.
How Do You Build a Peer Group for Comparable Company Analysis?
Comparable company analysis, often called "comps" or trading comps, values a stock by looking at what the market pays for similar businesses. It's the fastest of the major stock comparison methods, and the one most prone to sloppy peer selection.
Follow these rules when building your peer set:
- Start with industry classification, but don't stop there. A regional bank and an investment bank both sit in "financials," yet they have nothing in common operationally.
- Match by lifecycle stage and capital intensity, not just sector code. A capital-light software company and a capital-heavy industrial firm in the same GICS sector will trade at wildly different multiples for good reason, a point peer-relative scoring research from AssetNext makes explicit when describing functional similarity over strict sector matching.
- Control for size. A $2 billion company and a $200 billion company in the same industry often carry different risk profiles and different growth expectations baked into their multiples.
- Choose the right multiple for the business model: P/E for profitable, mature companies; EV/EBITDA when capital structures differ significantly; P/S for companies with thin or negative margins.
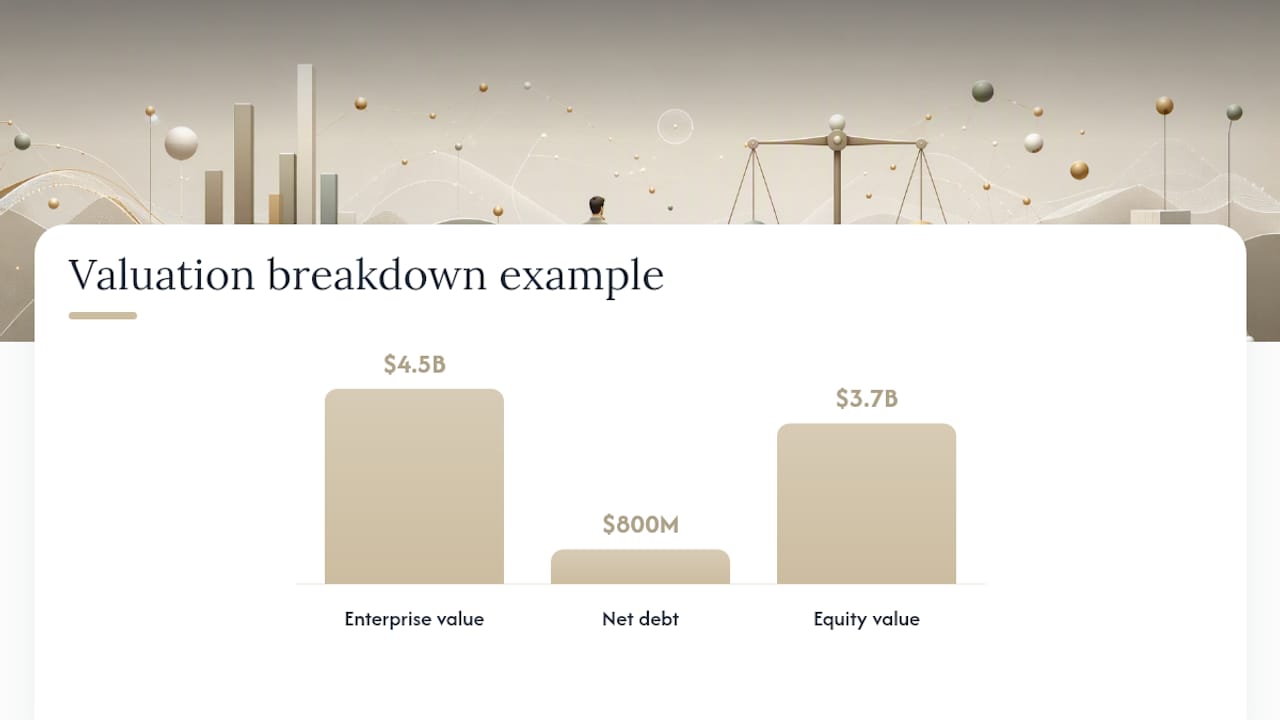
Here's a worked example. Your target company generates $500 million in EBITDA. Apply the peer multiple: 9 x $500 million = $4.5 billion enterprise value. Subtract net debt of $800 million, and you get roughly $3.7 billion in equity value. Divide by shares outstanding to land on an implied price per share, then compare that to where the stock actually trades.
Pro Tip: Comps assume the peer group itself is fairly valued on average. If the whole sector is overheated or oversold, your "fair" multiple just inherits that mispricing. Always run an independent DCF as a reality check on what comps are telling you, a caution echoed in Investopedia's peer comparison methodology.
What Do P/E, P/B, EV/EBITDA, P/S, and PEG Actually Tell You?
Each valuation multiple answers a slightly different question, and mixing them up is one of the fastest ways to misread a stock.
- P/E (price to earnings) shows what investors pay for a dollar of current profit. It's useless for unprofitable companies and can look artificially low for firms with declining earnings quality. Read more on how the price to earnings ratio behaves across different industries.
- P/B (price to book) compares market value to accounting net worth. It works well for banks and asset-heavy businesses, poorly for asset-light software or service companies.
- EV/EBITDA strips out the effects of debt and depreciation, making it useful when comparing companies with different capital structures.
- P/S (price to sales) is the fallback for unprofitable or early-stage companies, since revenue is harder to manipulate than earnings. Our breakdown on price to sales ratio covers where it can mislead too.
- PEG (P/E divided by growth rate) adjusts P/E for growth expectations, which helps separate a genuinely cheap stock from one that's cheap because growth is stalling. See our guide on the PEG ratio for the full calculation.
A lone low P/E or high dividend yield often reflects hidden risk, heavy leverage, or a mature company with little growth left, not a genuine bargain, according to research from HBS Working Knowledge. Read multiples together, and always in the context of the company's growth stage and sector.
How Do You Compare Two or More Stocks Side by Side?
Comparing stocks reliably means following the same sequence every time, not eyeballing whichever metric jumps out first.
Start with data collection and normalization:
- Pull fundamentals from a consistent source, aligning fiscal year ends and adjusting for any recent stock splits or one-time charges.
- Restrict your comparison set to companies of similar size and sector, unless you're deliberately testing a cross-sector thesis.
- Normalize for one-off items like asset sales, litigation charges, or pandemic-era distortions that can skew a single year's numbers.
- Pick 4 to 6 metrics tied to your actual goal. A value-focused comparison might weight P/E, P/B, and free cash flow yield. A growth-focused comparison might weight revenue growth, PEG, and gross margin trend.
- Run each candidate through your chosen valuation methods (DCF, comps, relevant multiples) and note where the signals agree and where they diverge.
- Stress-test the winner with a sensitivity check before committing capital.
A few habits separate a useful comparison from a misleading one:
- Weight metrics by what you're actually trying to achieve, not by which number looks most dramatic.
- Check multi-year trends instead of a single snapshot quarter.
- Verify leverage and debt maturity schedules before trusting a valuation multiple at face value, something our financial health analysis guide walks through in detail.
Side-by-side tools are genuinely useful for this kind of triage, but they can mislead if you don't control for sector and size differences yourself, a limitation StockEducation's own guide flags directly. The tool surfaces the data; the discipline of normalizing it is still on you.
Common Pitfalls in Stock Comparison and How to Avoid Them
Most beginner mistakes in stock comparison come down to skipping a normalization step, not misunderstanding the math.
- Mixing sectors. Comparing a bank's P/B to a software company's P/B tells you nothing. Fix it by staying within functionally similar peer groups.
- Trusting a snapshot instead of a trend. One quarter's earnings can be noisy. Check three to five year averages before drawing conclusions.
- Ignoring leverage and one-off items. A cheap-looking multiple can hide heavy debt or a temporary earnings boost. Cross-check against our DuPont analysis guide to see what's really driving return on equity.
- Overweighting a single metric. The lowest P/E in a group is rarely the best investment on its own. Pair it with qualitative checks on management and competitive position.
Pro Tip: Volatility itself is a signal worth checking before you finalize a comparison. A stock with a cheap multiple but wild price swings carries a different risk profile than a similarly cheap, stable one. This guide to market volatility breaks down why that distinction matters for risk-adjusted decisions.
How Does Oracle Investments Apply These Comparison Methods?
This tool scores a large number of stocks across profitability, valuation, and financial health, which maps almost directly onto the checklist above. Instead of building a DCF or pulling comps by hand every time, you get a starting point that's already normalized across peers.
- Scoring dimensions cover the same territory a manual comparison would: valuation multiples, growth trends, profitability, and balance sheet strength.
- Flagged risks and shortcuts, including owner-earnings style calculations, help you spot leverage or one-off distortions without building a spreadsheet from scratch. Our guide on calculating owner earnings explains the logic behind that shortcut.
- Deeper explainers like profitability ratios and moat analysis let you pair the score with a qualitative read on competitive advantage.
The score doesn't replace your own DCF. It shortens the triage step so you spend your time on the handful of stocks actually worth a deeper look.
How Should You Choose a Valuation Method for Your Goal?
If you're screening 30 stocks for one worth researching further, comps and multiples get you there fast. If you're deciding whether to hold a position for the next decade, a back-of-envelope DCF with a sensitivity table is worth the extra hour. My honest recommendation: shortlist with comps, then run a rough DCF only on names that clear that first filter. Practice on a scoring tool before trusting your own spreadsheet math with real money.
— Matt
Try Oracle Investments for Instant Stock Comparisons
Some tools turn the entire checklist above into something you can run in seconds instead of an afternoon with a spreadsheet. They allow scoring comparisons across profitability, valuation, and financial health for many stocks, provide side-by-side company comparisons, and portfolio tracking without switching between multiple data sources.

Some investment apps incorporate principles from legendary investors, so their scores reflect more than raw multiples. That matters most for beginners who understand the theory behind DCF and comps but want a faster way to apply it consistently across a watchlist. Whichever broker you use to execute trades, confirm it carries SIPC protection before committing real money.
Ready to see how your shortlist stacks up? Head to Oracle Investments and run your first side-by-side comparison today.
Sources
- Valuation notes — Kellogg School (Mauboussin & Korajczyk)
- Unveil Undervalued Stocks: The Peer Comparison Method — Investopedia
- Compare Stocks Side by Side — StockEducation
- SIPC — Securities Investor Protection Corporation
- The popular stock metric that can lead investors astray — HBS Working Knowledge
This article is general information, not a substitute for advice from a qualified financial advisor. Consult a qualified financial professional about your own circumstances before acting on anything here.
FAQ
What Is the 3-5-7 Rule in Stocks?
The 3-5-7 rule is a position-sizing guideline, not a valuation method: cap individual positions around 3% to 5% of a portfolio, to limit concentration risk. It has no direct link to which stock valuation method you use, but it's a useful risk control once your comparison work points you toward a candidate.
What Is a Good Tool to Compare Stocks?
A good comparison tool normalizes valuation, profitability, and financial health metrics across peers so you're not manually pulling data from filings for every stock. Oracle Investments does this with side-by-side scoring built for exactly that kind of triage.
Is DDM or DCF Better for Valuing a Stock?
Neither is universally better. DDM works well for stable, dividend-paying companies with predictable payout policies, while DCF is more flexible and fits growth companies, cyclicals, or any business where dividends don't reflect true cash generation.
Does Warren Buffett Use Technical or Fundamental Analysis?
Buffett is a fundamental investor, focused on business quality, competitive advantage, and owner earnings rather than price charts or trading patterns. His approach leans heavily on the kind of intrinsic value thinking behind DCF and owner-earnings calculations covered earlier in this guide.
How Many Metrics Should I Use to Compare Stocks?
Four to six metrics tied directly to your goal is usually enough. Piling on more than that tends to dilute the signal rather than sharpen it, since conflicting metrics start canceling each other out instead of pointing to a clear answer.