
Moat analysis is the process of determining whether a company's competitive advantage is durable enough to protect profits for years or decades, not just the current quarter. The immediate investor takeaway: a strong moat justifies a larger allocation and a longer holding period, because the underlying economics are harder to replicate. A weak or eroding moat, regardless of how good last year's earnings looked, is a reason to demand a steeper discount.
Three signals that a moat is real:
- ROIC persistently above WACC across multiple business cycles, not just in a single strong year
- Structural pricing power reflected in stable or expanding gross margins even as competitors enter
- Network effects or switching costs that make customers progressively harder to displace
Key Takeaways
A durable moat, confirmed by persistent ROIC above WACC and a clear structural source, is the single most reliable predictor of long-term compounding power in a stock.
| Point | Details |
|---|---|
| ROIC minus WACC is the core signal | Persistent positive spread across business cycles confirms economic value creation, not just accounting profit. |
| Five moat sources, each with distinct signals | Intangible assets, cost advantage, network effects, switching costs, and efficient scale each leave a different fingerprint in the financials. |
| Moats erode without reinvestment | Management that harvests rather than defends a moat can turn a wide-moat business into a value trap within a decade. |
| Score moats, then apply valuation discipline | A rubric score of 75-plus justifies a full position only when the entry price includes an adequate margin of safety. |
| Oracleinvestments accelerates the process | The app scores 260-plus stocks on profitability, valuation, and financial health, reducing manual screening time significantly. |
Table of Contents
- What is an economic moat and why does it matter to investors?
- The five recognized sources of competitive advantage
- How to identify and measure a moat using financial metrics
- How moats are built and the ways they collapse
- Real company examples: quick checks you can run in the financials
- Common mistakes investors make when applying moat analysis
- A repeatable scoring rubric you can apply in under an hour
- Why moat analysis works best as one input, not the whole answer
- Oracleinvestments scores moat-like signals across 260-plus stocks
- Sources
What is an economic moat and why does it matter to investors?
Warren Buffett popularized the term in his Berkshire Hathaway shareholder letters, using the image of a castle surrounded by water: the wider the moat, the harder it is for competitors to breach the walls. The underlying idea is simple. A company that earns above-average returns will attract competition. Without a structural barrier, that competition erodes margins until returns fall to the cost of capital. A moat is whatever prevents that from happening.
Investopedia's explainer frames it precisely: an economic moat is a durable competitive advantage that helps a company protect market share and sustain higher returns over time. The word "durable" is doing the heavy lifting there. A product that outsells rivals for two years is not a moat. A structural cost position, a network that gets more valuable as it grows, or a brand that commands a price premium decade after decade — those are moats.
Morningstar operationalizes this with a three-tier framework: no moat, narrow moat (advantage expected to persist roughly 10 years), and wide moat (20-plus years). That time-horizon framing is useful because it forces you to think about the mechanism, not just the current numbers. A company can have excellent margins today because of a lucky product cycle. A wide moat means the mechanism generating those margins is structurally protected.
Pro Tip: Treat moats as living assets, not permanent facts. Management's capital allocation decisions, specifically whether they reinvest in the sources of advantage or harvest them, determine whether a moat widens or quietly shrinks. A company that stops spending on R&D, brand, or network infrastructure can look profitable right up until it isn't.
The five recognized sources of competitive advantage
Morningstar identifies five primary sources of economic moats, and each one shows up differently in a company's financials and operations. Knowing which type you're looking at tells you where to look for evidence and what kind of erosion to watch for.
1. Intangible assets include patents, regulatory licenses, and brand recognition that competitors cannot easily replicate. Coca-Cola's brand is the textbook case: it commands a price premium in virtually every market on earth, and that premium shows up as gross margins that have stayed well above commodity beverage producers for generations. In financials, look for consistent pricing power relative to peers and low private-label substitution rates.
2. Cost advantage means producing the same product or service at structurally lower cost than rivals, not because of a temporary efficiency drive but because of scale, proprietary processes, or unique resource access. Walmart built its moat here: its distribution infrastructure and supplier leverage let it undercut competitors on price while still generating operating margins that smaller retailers cannot match. Check for unit cost trends relative to peers and whether the gap is widening or narrowing as the industry scales.
3. Network effects occur when a product or service becomes more valuable as more people use it. Visa is the clearest financial-sector example: every additional merchant that accepts Visa makes the card more useful to cardholders, and every additional cardholder makes acceptance more attractive to merchants. The financial fingerprint is high incremental margins as volume grows, because the marginal cost of adding a user is near zero once the network is built.
4. Switching costs are the friction, financial, operational, or psychological, that makes customers reluctant to leave even when a cheaper alternative exists. Microsoft's enterprise software stack is built on this. Migrating from Microsoft 365, Azure Active Directory, and Teams to a competing ecosystem is expensive, disruptive, and risky for any large organization.
5. Efficient scale applies when a market is large enough to support only one or a few competitors profitably, so new entrants would destroy their own returns by entering. This is common in regulated utilities, pipelines, and some regional markets. The financial signal is stable or rising market share with returns that would attract entry if the market were bigger, but don't because it isn't.
Pro Tip: Most durable moats combine two or more of these sources. Amazon's moat, for example, layers cost advantage (fulfillment scale), network effects (marketplace sellers and buyers), and switching costs (Prime membership and AWS lock-in). Single-source moats are more fragile.
How to identify and measure a moat using financial metrics
The core method combines quantitative persistence tests with qualitative evidence checks. Neither alone is sufficient. A company can show high ROIC in a single year because of a favorable commodity cycle; a company can have a great brand story without the margins to prove it matters. You need both.
The central quantitative signal is the ROIC minus WACC spread. When a company earns returns on invested capital that consistently exceed its cost of capital, it is creating economic value. The spread's magnitude matters, but so does its persistence across business cycles and the reinvestment runway available to compound it. Morgan Stanley's moat research frames this as a two-dimensional problem: how large is the spread, and how much capital can be deployed at that spread? A wide spread on a small capital base is less valuable than a moderate spread that can be reinvested at scale for decades.
| Moat type | Financial evidence | Qualitative evidence |
|---|---|---|
| Intangible assets | Gross margin premium vs. peers; pricing power | Patents, licenses, brand surveys, low private-label share |
| Cost advantage | Lower COGS/revenue ratio; higher operating leverage | Scale curves, proprietary processes, unique inputs |
| Network effects | High incremental margins; accelerating user growth | Platform data, cross-side network density |
| Switching costs | High net revenue retention; low churn | Long-term contracts, integration depth, migration costs |
| Efficient scale | Stable market share; returns above entry threshold | Regulated market, high fixed-cost structure, limited TAM |
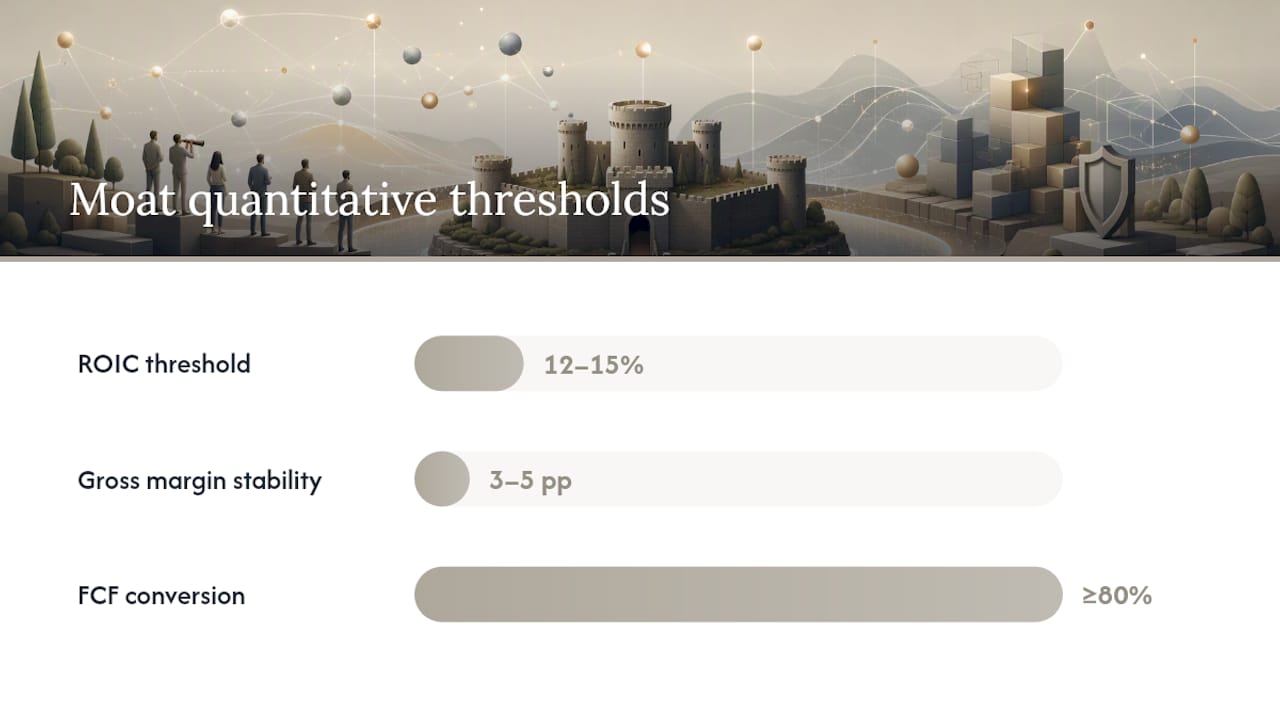
Practical thresholds worth tracking include sustained ROIC above typical industry benchmarks over a full business cycle as a reasonable starting filter, though capital-light businesses (software, payments) often run higher. Gross margin stability within a 3–5 percentage point band across a decade suggests pricing power. For a deeper look at how these ratios work together, the profitability ratios guide covers the mechanics in detail.
A quick checklist for a single research session:
- Pull 10 years of ROIC from the 10-K or a financial data provider. Is it consistently above 12–15%?
- Compare gross and operating margins to the three nearest public competitors. Is there a persistent premium?
- Check net revenue retention or churn data (in SaaS or subscription businesses, this is often in the shareholder letter or earnings call).
- Read the last three annual reports for management commentary on competitive positioning. Are they investing in the sources of advantage or harvesting them?
- Run a free cash flow conversion check: FCF divided by net income over five years. Consistently above 80% is a positive signal.
Pro Tip: Short-term ROIC spikes are noise. A company coming off a price-gouging cycle, a one-time asset sale, or a favorable commodity year can look like a moat business for 12–18 months. Always require multi-year persistence, ideally through at least one full economic downturn, before treating high ROIC as structural.
How moats are built and the ways they collapse
Moats are created through deliberate investment and advantaged structural positions. They erode through technological disruption, capital misallocation, or regulatory change, and the erosion is usually slow enough that investors miss it until the margin compression becomes undeniable.
How moats are built:
- Sustained R&D investment that converts into patents, proprietary processes, or platform capabilities competitors cannot replicate quickly
- Scale-driven cost leadership achieved by reinvesting efficiency gains rather than distributing them as short-term profit
- Network growth strategies that prioritize user acquisition and engagement over near-term monetization, building density before extracting value
- Product ecosystems that increase switching costs by deepening integration across a customer's workflow or infrastructure
Common erosion paths:
- Complacent management that harvests the moat through buybacks and dividends while underinvesting in the sources of advantage
- Margin compression from a new entrant with a structurally different cost model (cloud computing vs. on-premise software is the canonical example)
- Regulatory entry that forces a previously protected market to accept competition (telecom deregulation, pharmaceutical patent cliffs)
- Platform commoditization, where a layer of the technology stack becomes a utility and the value migrates to a different layer
The Morgan Stanley moat research makes the reinvestment point explicitly: failure to invest can turn a previously wide moat into a value trap. The financials look fine until they don't, because the moat was being liquidated, not maintained.
A specific warning on confirmation bias: past profits are not proof of a current moat. They are evidence that a moat existed. The question is whether the mechanism is still intact and whether management is actively defending it. Check reinvestment rates, R&D as a percentage of revenue, and whether the company is gaining or losing share in its core market before concluding the moat is still wide.
Real company examples: quick checks you can run in the financials
These six companies each illustrate a different moat type in action. For each one, three metric checkpoints give you a starting point for your own verification.
Coca-Cola (intangible assets / brand) Coca-Cola's moat is almost entirely brand-driven, reinforced by a global distribution network. The brand commands a price premium in markets where generic alternatives cost a fraction of the price, yet volume holds. Check: (1) gross margin relative to private-label beverage producers, (2) pricing power in emerging markets where brand loyalty is still being built, (3) advertising spend as a percentage of revenue to confirm the brand is being maintained, not harvested.
Microsoft (switching costs) Microsoft's enterprise moat is one of the most studied in technology. Azure, Microsoft 365, and Teams create a web of integrations that make migration prohibitively expensive for large organizations. Check: (1) commercial cloud revenue retention rates (disclosed in earnings), (2) Azure revenue growth relative to infrastructure spend, (3) operating margin in the Productivity and Business Processes segment, which reflects the pricing power of the installed base.
Amazon (cost advantage + network effects) Amazon's moat layers fulfillment scale with a two-sided marketplace and AWS infrastructure dominance. The cost advantage in fulfillment is structural: the network of warehouses and last-mile logistics took decades to build and cannot be replicated quickly. Check: (1) AWS operating margin versus the segment's revenue growth rate, (2) third-party seller services revenue as a share of total, which reflects marketplace network density, (3) fulfillment cost per unit trends over time.
Visa (network effects) Visa's moat is a textbook two-sided network: merchants need cardholders, cardholders need merchant acceptance, and both sides reinforce each other. The financial expression is high incremental margins and near-zero marginal cost per additional transaction. Check: (1) net revenue margin (Visa keeps a small percentage of every transaction), (2) payment volume growth relative to headcount growth (a proxy for operating leverage), (3) market share in global card payment volume.
Walmart (cost advantage) Walmart's distribution infrastructure and supplier leverage represent a cost advantage that has compounded over 60 years. No competitor has replicated the density of its logistics network at comparable scale. Check: (1) COGS as a percentage of revenue versus regional grocery and general merchandise peers, (2) inventory turnover relative to competitors, (3) operating margin stability through inflationary periods, which tests whether the cost advantage holds under pressure.
NVIDIA (intangible assets + switching costs) NVIDIA's moat has two reinforcing layers: the CUDA software ecosystem, which represents years of developer investment that is not portable to competing hardware, and the GPU architecture lead in AI training workloads. Check: (1) data center revenue growth and gross margin in that segment, (2) CUDA developer adoption metrics (referenced in earnings calls), (3) ROIC trend over the past five years, which has expanded sharply as AI demand accelerated.
Pro Tip: For each company, pull the five-year ROIC trend alongside the gross margin trend. If both are stable or expanding, the moat is likely intact. If gross margins are holding but ROIC is declining, check whether the company is over-investing or whether the capital base is growing faster than returns, which can signal moat erosion even when the income statement looks fine.
Common mistakes investors make when applying moat analysis
Moat analysis is a powerful filter, but it is not a standalone buy signal. Used carelessly, it produces exactly the kind of overconfidence that leads to overpaying for quality.
Mistakes that show up repeatedly:
- Treating moats as permanent. No moat is guaranteed. Kodak had a moat. Blockbuster had a moat. Nokia had a moat. The mechanism that created the advantage can be disrupted faster than a long-term investor expects, particularly when the disruption comes from a different industry rather than a direct competitor.
- Relying on single-year metrics. One year of high ROIC or strong margins proves nothing about durability. Investopedia's analysis notes that persistence across business cycles is the key differentiator between a structural advantage and a favorable moment.
- Ignoring industry structure. A company can have excellent internal economics and still face structural headwinds from a deteriorating industry. Moat analysis must account for Porter's Five Forces at the industry level, not just the company's relative position within it.
- Over-weighting brand without margin data. Brand recognition is not a moat unless it translates into pricing power. A well-known brand that cannot raise prices without losing volume is not protecting profits.
- Anchoring on narrative. Management teams are skilled at telling compelling moat stories. The financials are the check. If the story says "strong competitive position" but ROIC has been declining for five years, trust the numbers.
Structural limitations to keep in mind:
Moat measurement is inherently backward-looking. The metrics you can observe, ROIC, margins, retention, reflect what the moat produced in the past. Estimating future durability requires judgment about technology trajectories, regulatory environments, and management quality that no spreadsheet fully captures. The S&P DJI systematic framework addresses this by linking moat identification to lifecycle analysis, recognizing that a company's competitive position shifts as its industry matures.
Scale advantages can also become liabilities. Large incumbents with wide moats sometimes move too slowly to respond to nimble entrants, not because the moat has eroded but because the organizational structure that built it becomes resistant to the kind of disruption that would cannibalize existing revenue.
Pro Tip: Combine moat signals with valuation discipline. If the stock is still attractive, the margin of safety is real.
A repeatable scoring rubric you can apply in under an hour
The core method: use a weighted rubric that combines moat type evidence, financial persistence, reinvestment runway, and erosion risk. The output is a 0–100 moat durability score that maps to a portfolio action.
The rubric (four categories, 25 points each):
-
Moat type and source clarity (0–25 points): Can you name the specific moat type and point to the mechanism? One clear, well-documented source scores 15–20. Two reinforcing sources score 20–25. No identifiable source scores 0–5.
-
Financial persistence (0–25 points): ROIC above WACC for 7-plus years scores 20–25. Five to seven years scores 12–19. Fewer than five years or inconsistent scores 0–11. Add 3 points if gross margin premium versus peers has been stable or widening.
-
Reinvestment runway (0–25 points): Is the company reinvesting in the sources of advantage? R&D growth, network investment, or distribution expansion that exceeds revenue growth scores 18–25. Flat reinvestment scores 10–17. Declining reinvestment or heavy buyback-only capital return scores 0–9.
-
Erosion risk (0–25 points): Score this inversely. Low erosion risk (no credible technological threat, stable regulatory environment, high switching costs) scores 20–25. Moderate risk scores 10–19. High erosion risk (active disruption, regulatory pressure, commoditizing technology) scores 0–9.
Worked example (generic technology platform):
Total: 87 out of 100.
Score-to-action conversion:
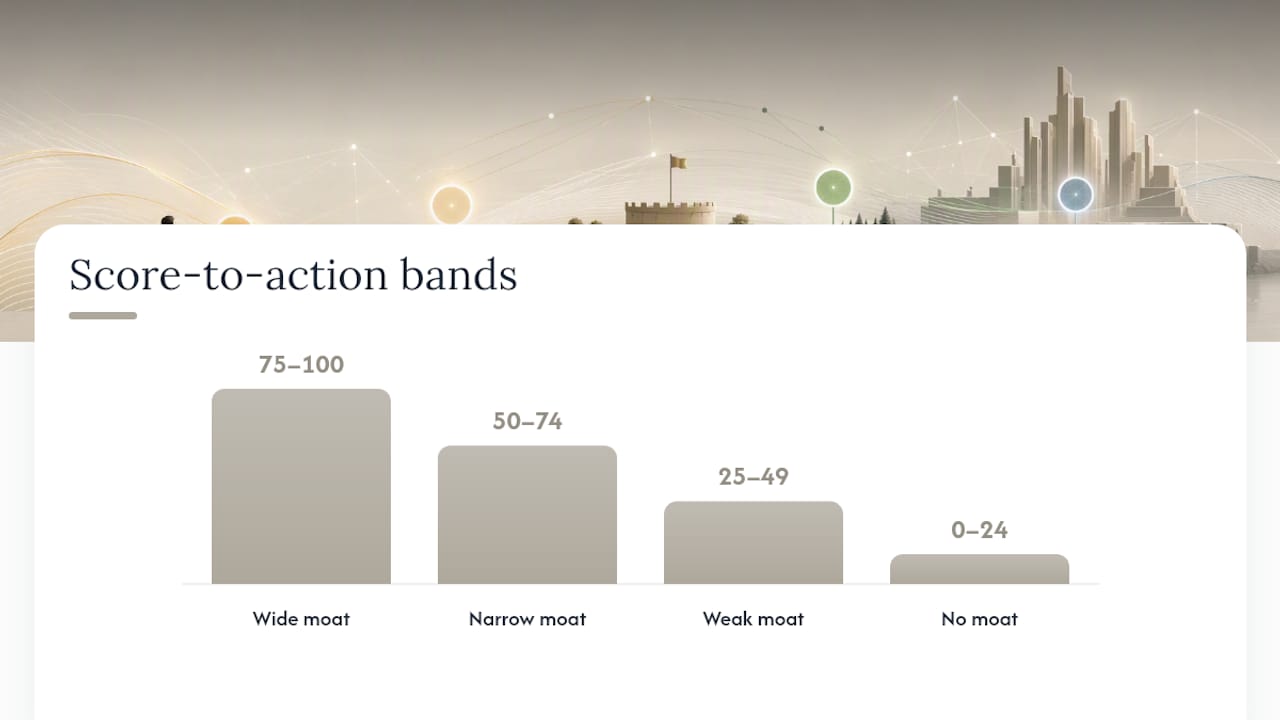
- 75–100: Wide moat. Full position sizing justified if valuation supports it. Monitor annually.
- 50–74: Narrow moat. Smaller position. Require a larger margin of safety on valuation. Monitor semi-annually.
- 25–49: Weak or uncertain moat. Treat as a cyclical or special-situation investment, not a compounder. Monitor quarterly.
- 0–24: No identifiable moat. Require deep value pricing or avoid entirely.
Sequential checklist (30–60 minutes using public filings):
- Read the most recent 10-K business description. Identify the claimed competitive advantage and test whether it maps to one of the five moat types.
- Pull 10 years of ROIC from the income statement and balance sheet. Calculate the ROIC minus WACC spread for each year.
- Compare gross and operating margins to three direct competitors over the same period.
- Check the capital allocation section of the annual report: what percentage of free cash flow goes to reinvestment versus buybacks and dividends?
- Identify the top two credible threats to the moat (technology, regulation, new entrant) and assess their current traction.
- Score each rubric category and sum the total.
- Cross-reference the score against current valuation multiples. A score of 80-plus at 40x earnings still requires a valuation judgment.
For a practical guide on reading value ratings alongside moat scores, Oracle's value rating explainer walks through how to integrate multiple signals into a single decision framework.
Pro Tip: The rubric is a starting point, not a verdict. Use it to structure your thinking and surface the questions worth investigating further, not to replace judgment. A score of 70 with one category you genuinely cannot assess is less reliable than a score of 60 where you understand every component.
Why moat analysis works best as one input, not the whole answer
The investors who use moat analysis most effectively treat the score as a filter, not a conclusion. A high moat score tells you the business is worth understanding deeply. It does not tell you whether the stock is priced to deliver acceptable returns.
The honest limitation of moat analysis is that it is structurally backward-looking. Every metric you can observe, ROIC, margins, retention, reflects what the moat produced historically. The judgment about whether those conditions persist for another decade requires reading technology trajectories, management quality, and competitive dynamics in ways that a rubric can structure but cannot resolve. Oracleinvestments integrates moat-like signals, profitability, financial health, and valuation, into a single stock score across more than 260 companies, which helps surface candidates worth investigating without replacing the qualitative judgment that moat analysis ultimately requires.
One realistic limitation deserves plain statement: a wide moat does not justify ignoring valuation or macro risks. Some of the worst long-term investment outcomes have come from buying genuinely excellent businesses at prices that assumed the moat would widen indefinitely. The moat score tells you what you own. The price tells you what you paid. Both matter.
Oracleinvestments scores moat-like signals across 260-plus stocks
Running the full moat rubric manually for a single company takes 30–60 minutes. Doing it across a portfolio of candidates takes days. Oracleinvestments cuts that time sharply by scoring over 260 stocks on the financial fundamentals that underpin moat strength: profitability, valuation, and financial health, all in one place.

The app lets you compare companies side by side in seconds, surfacing the margin premiums, ROIC trends, and financial health signals that the rubric above asks you to find in 10-Ks. It also integrates the investment frameworks of Buffett, Munger, and Lynch directly into the scoring logic, so the qualitative wisdom behind moat thinking is built into every rating. Whether you're screening for wide-moat candidates or tracking whether a current holding's fundamentals are holding up, Oracleinvestments gives you the data layer the rubric needs, without the spreadsheet hours.
Sources
- Measuring the moat (Morgan Stanley research)
- What Makes a Moat? Morningstar’s Five Sources of Moat
- How an Economic Moat Provides a Competitive Advantage
- Berkshire Hathaway shareholder letters (example: 1995)
This article is general information, not a substitute for advice from a qualified financial advisor. Consult a qualified financial professional about your own circumstances before acting on anything here.