
DuPont analysis decomposes return on equity (ROE) into three measurable drivers: net profit margin, asset turnover, and the equity multiplier. The formula is:
ROE = Net Profit Margin × Asset Turnover × Equity Multiplier
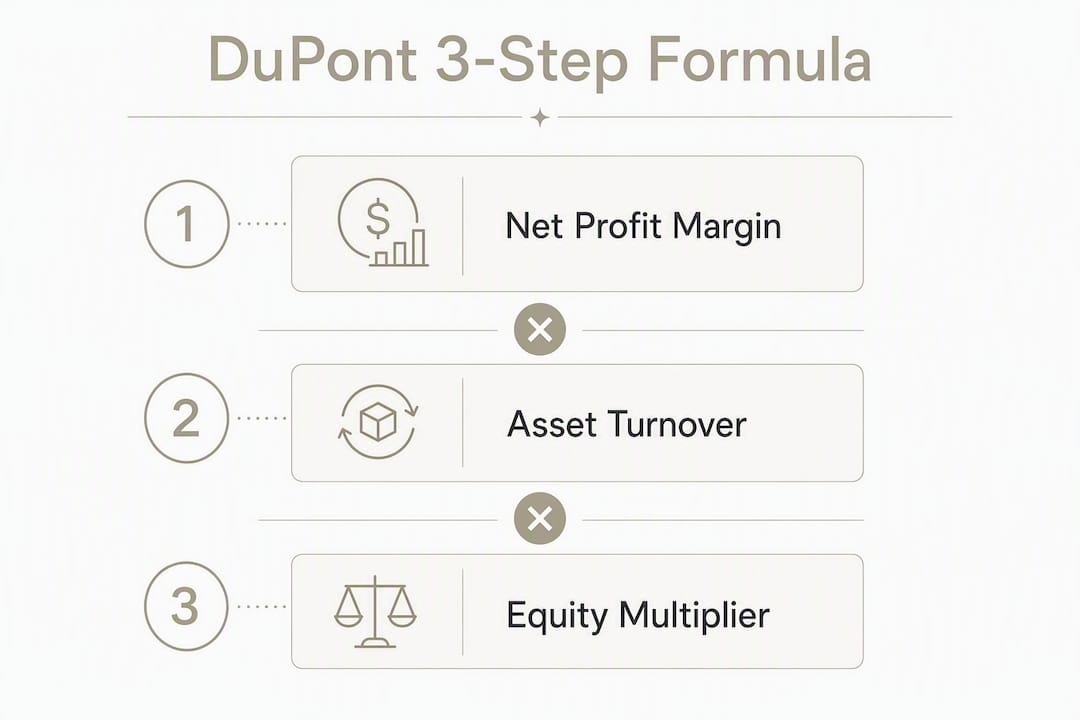
That single equation turns a headline ROE figure into a diagnostic. ROE could mean a company earns fat margins on modest sales, spins assets furiously on thin margins, or borrows heavily to amplify modest operating returns. The DuPont decomposition tells you which one, and that distinction shapes every investment judgment that follows.
Run it when you need to:
- Compare two companies with similar ROE but potentially different risk profiles
- Diagnose why a company's ROE changed year over year
- Screen for earnings quality before a deeper fundamental review
- Spot leverage-driven ROE increases that could mask rising financial risk
Table of Contents
- What is DuPont analysis and why does it matter?
- How does the 3-step DuPont formula work?
- What does the 5-step DuPont model add?
- How to calculate DuPont from real financial statements
- How do you interpret what the drivers are telling you?
- What are the main limitations of DuPont analysis?
- How do you use DuPont for peer comparison and trend analysis?
- What tools help you run DuPont faster?
- Key Takeaways
- The metric most investors use wrong
- Run your DuPont analysis faster with Oracleinvestments
- Useful sources and further reading
What is DuPont analysis and why does it matter?
The framework traces back to Donaldson Brown, a financial engineer at DuPont Corporation who formalized the decomposition in the 1920s. The company needed a way to evaluate divisional performance, and the multiplicative structure solved that problem elegantly. Nearly a century later, the approach remains standard in equity research and corporate finance because the core insight has not aged: ROE as a single number tells you almost nothing about how returns are generated.
The practical value is in the levers. Profitability, efficiency, and leverage each respond to different management decisions and carry different risk profiles. A retailer improving inventory turns is doing something fundamentally different from a utility taking on more debt, even if both show a rising ROE. The DuPont model makes that difference visible.
Common use cases:
- Investor screening: Filter stocks where ROE growth is margin-driven rather than leverage-driven
- Management diagnostics: Identify which operational lever is underperforming relative to peers
- Peer benchmarking: Compare companies within the same sector on a like-for-like basis
Pro Tip: Start with the 3-step model for initial screening. Practitioners typically switch to the 5-step version only when taxes or interest expense appear to be driving a change in ROE, because the extra components add interpretive complexity without benefit when operating results are straightforward.
How does the 3-step DuPont formula work?
The three-factor model rests on a clean algebraic identity. Write out ROE in full:
ROE = Net Income / Shareholders' Equity
Then multiply and divide by Revenue and Total Assets without changing the value:
ROE = (Net Income / Revenue) × (Revenue / Total Assets) × (Total Assets / Shareholders' Equity)
Which gives you:
ROE = Net Profit Margin × Asset Turnover × Equity Multiplier

You can also express this as ROE = ROA × Equity Multiplier, where ROA (return on assets) equals Net Profit Margin × Asset Turnover.
Defining each component
Net Profit Margin = Net Income / Revenue. Measures how many cents of profit survive after all costs, taxes, and interest. Pull net income from the bottom of the income statement and total revenue from the top line.
Asset Turnover = Revenue / Average Total Assets. Measures how efficiently the company generates sales from its asset base. Use the average of beginning and ending total assets from the balance sheet, not the year-end figure alone.
Equity Multiplier = Average Total Assets / Average Shareholders' Equity. Measures financial leverage. An equity multiplier greater than 1 means the company holds more assets than equity, with the rest funded by debt.
What a change in each component signals
- Rising net profit margin: better pricing power, cost control, or product mix
- Rising asset turnover: improved operational efficiency or asset-light growth
- Rising equity multiplier: more debt relative to equity, amplifying both returns and risk
What does the 5-step DuPont model add?
The expanded model splits net profit margin into three sub-components, giving you a cleaner view of where profitability is coming from:
ROE = Tax Burden × Interest Burden × EBIT Margin × Asset Turnover × Equity Multiplier
Component definitions
Tax Burden = Net Income / EBT (earnings before tax). Tax burden measures the proportion of pre-tax earnings the company keeps after paying taxes. Higher is better; a sudden drop often signals a one-time tax charge or an expiring deferred tax benefit.
Interest Burden = EBT / EBIT (earnings before interest and taxes). Measures how much operating profit survives after interest expense. Interest burden measures how much operating profit survives after interest expense; lower values indicate higher interest costs.
EBIT Margin = EBIT / Revenue. The pure operating profitability measure, stripped of financing and tax effects.
Asset turnover and equity multiplier carry the same definitions as in the 3-step model.
When to use the 5-step version
The expanded model earns its complexity in three situations: comparing companies across different tax jurisdictions, analyzing the impact of a capital structure change (new debt issuance, refinancing), and forensic diagnostics where you suspect tax or interest manipulation is flattering the headline ROE.
One important caution: when EBIT or EBT is negative, the multiplicative product becomes misleading. A negative interest burden combined with a negative EBIT margin can produce a positive product that looks like strong ROE. In those cases, isolate the specific negative driver and report the diagnosis directly rather than relying on the combined formula.
How to calculate DuPont from real financial statements
Where to find each input
For U.S. GAAP filings (available on SEC EDGAR):
| Input | Statement | Line item |
|---|---|---|
| Net Income | Income Statement | Bottom line, after tax |
| Revenue | Income Statement | Top line (net revenues) |
| EBIT | Income Statement | Operating income |
| EBT | Income Statement | Income before income taxes |
| Total Assets (avg.) | Balance Sheet | Average of prior and current year-end |
| Shareholders' Equity (avg.) | Balance Sheet | Average of prior and current year-end |
Using averages for balance-sheet items is the single most common correction analysts make. Year-end figures distort ratios for seasonal businesses and for any company that completed a large acquisition or buyback mid-year.
Worked numeric example
Assume a mid-size manufacturer with the following figures:
| Item | Year 1 | Year 2 |
|---|---|---|
| Revenue | — | $520M |
| Net Income | — | $50M |
| EBIT | — | $72M |
| EBT | — | $63M |
| Total Assets | $380M | $400M |
| Shareholders' Equity | $190M | $200M |
Averages for Year 2: Total Assets = ($380M + $400M) / 2 = $390M; Shareholders' Equity = ($190M + $200M) / 2 = $195M
Step-by-step calculation (Year 2):
- Net Profit Margin = $50M / $520M = 9.6%
- Asset Turnover = $520M / $390M = 1.33×
- Equity Multiplier = $390M / $195M = 2.0×
- ROE = 9.6% × 1.33 × 2.0 = 25.5%
For the 5-step version:
- Tax Burden = $50M / $63M = 0.79
- Interest Burden = $63M / $72M = 0.88
- EBIT Margin = $72M / $520M = 13.8%
- ROE = 0.79 × 0.88 × 13.8% × 1.33 × 2.0 = 25.5% (same result, more granular)
Pro Tip: Build this layout in Excel with one row per year. When you add a third or fourth year, the trend in each component becomes visible immediately. Flag any year where the equity multiplier rises while EBIT margin falls — that combination often signals a company borrowing to mask deteriorating operations.
How do you interpret what the drivers are telling you?
The same ROE can mean very different things depending on which component is doing the work. DuPont analysis shows whether companies with similar ROE rely on different drivers, and that difference matters for sustainability and risk.
Margin-driven ROE is typical of luxury goods, branded pharmaceuticals, and enterprise software. These businesses earn high net profit margins (sometimes 20–30%) on relatively modest asset bases. Their ROE is durable because it flows from pricing power, not financial engineering.

Turnover-driven ROE characterizes grocery retail, fast fashion, and distribution businesses. Margins are thin (often 2–5%), but assets cycle rapidly. The risk here is volume sensitivity: a demand slowdown hits ROE hard because there is no margin cushion.
Leverage-driven ROE is the norm in banking, utilities, and real estate. The equity multiplier can run 8–12× in banking, which amplifies even modest ROA into double-digit ROE. When rising ROE is driven primarily by an increasing equity multiplier, check debt maturity schedules and interest coverage before treating that ROE as a positive signal.
Peer comparison: same ROE, different stories
| Metric | Company A (Retailer) | Company B (Manufacturer) |
|---|---|---|
| Equity Multiplier | 2.0× | — |
Wait, the ROE differs here, which makes the contrast sharper. Company A's returns depend entirely on volume and asset velocity. Company B earns its ROE through margins, with modest leverage. A margin compression of 2 percentage points would cut Company A's ROE nearly in half; Company B could absorb the same hit and still post a respectable return.
What are the main limitations of DuPont analysis?
The framework is powerful but not self-correcting. Common pitfalls:
- Year-end balance-sheet figures: Using period-end rather than average assets and equity distorts both asset turnover and the equity multiplier, especially for seasonal businesses
- Share buybacks: Buybacks reduce the equity base, mechanically inflating the equity multiplier and ROE without any improvement in operations
- GAAP vs. IFRS differences: Lease capitalization under ASC 842 (U.S. GAAP) adds assets to the balance sheet that IFRS 16 treats similarly but with different timing; peer comparisons should stay within the same accounting regime
- Nonrecurring items: A one-time asset sale or tax benefit can spike net profit margin in a single year, making trend analysis misleading without adjustment
- Negative denominators: Negative equity (from accumulated losses or aggressive buybacks) produces a negative equity multiplier, which makes the multiplicative ROE formula uninterpretable
Adjustments worth making
Strip out nonrecurring items from net income before computing the margin. For buyback-heavy companies, track the equity multiplier separately and note how much of its change reflects debt versus equity reduction. When comparing across borders, normalize for effective tax rates rather than relying on the raw tax burden ratio.
Complementary metrics to pair with DuPont
ROIC addresses the leverage blind spot directly by measuring returns on all invested capital, not just equity. Pair it with interest coverage (EBIT / Interest Expense) to assess whether leverage-driven ROE is sustainable, and with free cash flow to confirm that reported earnings are converting to cash. The debt-to-equity ratio gives you the balance-sheet context behind the equity multiplier.
How do you use DuPont for peer comparison and trend analysis?
Selecting valid peers
A DuPont comparison is only meaningful when the companies share the same structural context. Before running numbers, confirm:
- Same industry and subsector (a specialty retailer vs. a grocery chain will show different turnover profiles by design)
- Similar capital intensity (asset-heavy manufacturers vs. asset-light software companies are not comparable on asset turnover)
- Same accounting standards (U.S. GAAP vs. IFRS comparisons require normalization)
- Similar business cycle exposure (comparing a fiscal Q4-heavy retailer to a steady-state industrial mid-cycle distorts averages)
Running a trend analysis
Compute each component ratio for at least three to five years. Lay them in columns in Excel so you can read the direction of each driver independently. Then ask:
- Is ROE rising? Which component is driving it?
- Is the equity multiplier creeping up while EBIT margin stays flat or falls?
- Is asset turnover declining, suggesting the company is becoming less efficient with its asset base?
Watch for equity base changes from buybacks (the multiplier rises without new debt), asset base changes from acquisitions (turnover can drop sharply in the year of a large deal), and interest expense shifts from refinancing. Each of these can move a component ratio without reflecting any change in underlying business performance.
What tools help you run DuPont faster?
Building an Excel template
A workable template needs six input cells per year: Revenue, Net Income, EBIT, EBT, beginning and ending Total Assets, and beginning and ending Shareholders' Equity. From those, calculate averages and then each ratio in sequence. Add a chart that plots all three 3-step components over time, and the trend diagnostics become visual rather than numerical.
For the 5-step version, add EBIT and EBT rows and compute Tax Burden and Interest Burden as additional columns. The whole model fits on a single sheet.
Other tool options
- Web-based financial calculators automate the arithmetic once you enter the line items manually; useful for a quick check but limited for multi-year trend work
- API-based data tools pull financial statement data directly and can populate a DuPont template automatically, which saves the manual transcription step for large peer sets
- Portfolio analysis platforms that score stocks on fundamental metrics can surface DuPont-relevant ratios alongside valuation and financial health signals in one view
Oracleinvestments scores over 260 stocks on profitability, valuation, and financial health, giving you the ratio-level detail that feeds directly into a DuPont-style diagnostic without building every formula from scratch.
Key Takeaways
DuPont analysis is the most direct way to determine whether a company's ROE is driven by genuine operational strength or by financial leverage that could unwind under stress.
| Point | Details |
|---|---|
| Start with the 3-step model | Compute Net Profit Margin × Asset Turnover × Equity Multiplier before adding complexity. |
| Always use averages | Average beginning and ending balance-sheet figures to avoid distortions from seasonality or mid-year transactions. |
| Diagnose leverage-driven ROE | A rising equity multiplier without margin or turnover improvement signals financial risk, not operational strength. |
| Pair with ROIC and interest coverage | DuPont alone does not capture capital efficiency or debt sustainability; complementary metrics close that gap. |
| Oracleinvestments accelerates the workflow | The app scores 260+ stocks on the fundamentals that feed DuPont diagnostics, cutting manual data-gathering time. |
The metric most investors use wrong
ROE gets cited constantly as a quality signal, and DuPont is the tool that explains why that citation is so often misleading. The number that shows up in a stock screener is the product of three very different business realities, and treating it as a single quality score is how investors end up holding companies that look profitable on paper but are quietly accumulating debt to sustain the appearance.
The leverage point is where the framework earns its keep. A company can run a perfectly mediocre business, borrow aggressively, and post a 25% ROE that looks competitive against peers. Without decomposing the equity multiplier, you would never see it. The EBIT margin and asset turnover tell the real story: flat or declining, while the multiplier climbs. That pattern has preceded more than a few high-profile deteriorations in credit quality.
The other underappreciated use is time-series work. Most analysts run DuPont as a point-in-time snapshot, but the real signal is in the direction of each component over three to five years. A company where margins are expanding, turnover is holding steady, and the multiplier is flat or declining is compounding quality. That combination is rarer than the headline ROE suggests.
Run your DuPont analysis faster with Oracleinvestments
Pulling six line items from financial statements, computing averages, and building a multi-year trend table takes time. Oracleinvestments cuts that process down to seconds.

The app scores over 260 stocks on the profitability, valuation, and financial health metrics that map directly onto DuPont components. You get instant ratio breakdowns, side-by-side peer comparisons across the same sector, and the fundamental scores that help assess whether a company's ROE is backed by real operational strength. The worked example in this article is reproducible offline in Excel, but for ongoing research across a portfolio, Oracleinvestments gives you the same diagnostic depth without rebuilding the model for every new stock. Download the app and run your first DuPont-style breakdown today.
This article is general financial information, not investment advice. Confirm figures against current financial statements and consult a qualified financial professional before making investment decisions.
Useful sources and further reading
- DuPont Analysis: Definition, Uses, Formulas, and Examples — Investopedia's reference entry covering the 3-step formula, component definitions, and key pitfalls including the averaging requirement
- DuPont Analysis: Overview, Formula, Example — The Motley Fool's treatment, with a clear warning on leverage-driven ROE and what to check next
- DuPont Analysis — Wikipedia — Concise overview of the framework's history, algebraic derivation, and use in financial analysis
- SEC EDGAR — Primary source for U.S. GAAP financial statements; use to pull the exact line items needed for any DuPont calculation