
Owner earnings measures the cash a business generates for its owners after subtracting what it must spend to maintain itself. Warren Buffett coined the term in the 1986 Berkshire Hathaway annual report, defining it as reported earnings plus depreciation and other non-cash charges, minus the capital spending needed to keep the business competitive. Investors favor it over reported net income because accounting earnings can hide how much cash actually gets left over once the business reinvests in itself. This guide walks through the formula, the estimation choices, and a full worked example.
TL;DR:
- Estimating maintenance capex using depreciation, historical averages, or property-to-sales ratios helps determine more accurate owner earnings.
- Owner earnings exclude growth-related capital expenditures, unlike free cash flow, making them more reliable for valuation of capital-intensive businesses.
- Cross-checking multiple estimation methods reduces errors caused by irregular investment cycles and seasonal fluctuations in a company's financials.
- Relying on a single year's owner earnings can be misleading; analyzing multi-year averages and free cash flow provides a clearer picture.
- Using tools that automate owner earnings calculations saves time and improves consistency when comparing hundreds of stocks.
Table of Contents
- What Is the Owner Earnings Formula and Its Components?
- How Do You Estimate Maintenance Capex and Working Capital?
- Owner Earnings vs. Free Cash Flow: What's the Difference?
- What Does a Step-by-Step Owner Earnings Calculation Look Like?
- How Do Investors Use Owner Earnings in Valuation?
- What Are the Limitations of Owner Earnings?
- How Does Oracle Investments Speed Up Owner Earnings Analysis?
- What Do Students Get Wrong About Owner Earnings?
- A Faster Way to Calculate Owner Earnings
- Sources
What Is the Owner Earnings Formula and Its Components?
Buffett's original wording defined owner earnings as reported earnings plus depreciation, depletion, amortization, and other non-cash charges, minus the average annual capital expenditures required to maintain long-term competitive position and unit volume. Stripped down for practical use, the modern formula looks like this:
Owner earnings = Net income + D&A + other non-cash charges − maintenance capex ± change in working capital
"Other non-cash charges" covers items like asset impairments, deferred tax adjustments, and, in some cases, add-backs for stock-based compensation, though many analysts argue stock comp should stay excluded since it's a real economic cost even without a cash outlay.
You'll pull each piece from a different statement:
- Net income comes from the income statement, at the bottom line.
- D&A and other non-cash charges appear on the cash flow statement, in the operating activities section.
- Capital expenditures show up underinvesting activities on the cash flow statement, though the split between maintenance and growth capex almost never gets disclosed directly.
- Working capital changes live on the cash flow statement too, buried inside line items for receivables, payables, and inventory.
The gotcha: companies rarely break out maintenance versus growth spending, so you'll need to estimate that split yourself.
How Do You Estimate Maintenance Capex and Working Capital?
Separating maintenance capex from growth capex matters because lumping them together either overstates or understates true owner earnings. A retailer opening 40 new stores a year spends very differently than one just replacing worn fixtures in existing locations, and Buffett's own formula treats this maintenance figure as an estimate, not a hard number pulled from a filing.
Three practical methods work well:
- Depreciation as a floor. Assume maintenance capex roughly equals depreciation expense. It's imperfect, especially for asset-heavy businesses with aging plants, but it's a fast starting point.
- Multi-year average capex. Average total capital spending over five to ten years to smooth out lumpy investment cycles, then compare that average against depreciation to sanity-check the estimate.
- Greenwald's PPE-to-sales method. Divide average net property, plant, and equipment by average sales to get a ratio, then multiply that ratio by the incremental sales growth for the year. Subtract that growth-driven portion from total capex, and what remains approximates maintenance capex.
For working capital, only include changes tied to normal operations: swings in inventory, receivables, and payables. A one-time inventory buildup ahead of a product launch shouldn't get treated the same as a steady seasonal pattern that repeats every year.
Pro Tip: Run all three capex methods side by side on the same company. If they land within a reasonable range of each other, you've got a defensible estimate. If they diverge wildly, that's usually a sign the business has irregular investment cycles worth investigating before you trust any single number.
Owner Earnings vs. Free Cash Flow: What's the Difference?
Owner earnings and free cash flow both try to answer the same question: how much cash can the business actually distribute? But they get there differently.
- Net income reflects GAAP accounting rules and includes non-cash charges that don't represent real cash outflows.
- Free cash flow typically equals operating cash flow minus total capex, without distinguishing maintenance spending from growth spending.
- Owner earnings go a step further than free cash flow by isolating only the capex needed to sustain the business, leaving growth spending untouched.
The two metrics diverge most sharply when a company is investing heavily for expansion. FCF drops because all that capex gets subtracted, while owner earnings stays healthier because it only nets out the maintenance portion. Use FCF for a quick screen across dozens of companies. Reach for owner earnings when you're doing serious valuation work on a company you're actually considering buying.
What Does a Step-by-Step Owner Earnings Calculation Look Like?
Take a simplified manufacturing company with these figures for the year:
| Line item | Amount |
|---|---|
| Net income | a substantial amount |
| Depreciation & amortization | a significant amount |
| Other non-cash charges | a moderate amount |
| Total capital expenditures | a sizable amount |
| Estimated maintenance capex (via PPE to sales) | an estimated portion |
| Increase in working capital | a notable change |
Here's the arithmetic:
- Start with net income: a substantial figure.
- Add back D&A and other non-cash charges: the sum increases by significant amounts.
- Subtract estimated maintenance capex (not total capex, which would understate owner earnings by ignoring the growth portion): this reduces the figure by an estimated portion.
- Subtract the increase in working capital, since that cash got tied up in operations: this further reduces the figure to an amount representing cash available to owners.
That $51 million represents cash the owners could theoretically pull out without weakening the business's competitive standing. Compare that to the $50 million net income figure and you'll notice they're close here, but that gap widens fast in capital-intensive industries where D&A and capex diverge sharply.
How Do Investors Use Owner Earnings in Valuation?
The most direct application is owner-earnings yield: divide owner earnings by market cap (or enterprise value, if you want to account for debt). A company trading at a market cap of a billion dollars with a certain amount in owner earnings has a yield around a few percent, which you can then compare against bond yields or other stocks to judge relative cheapness.
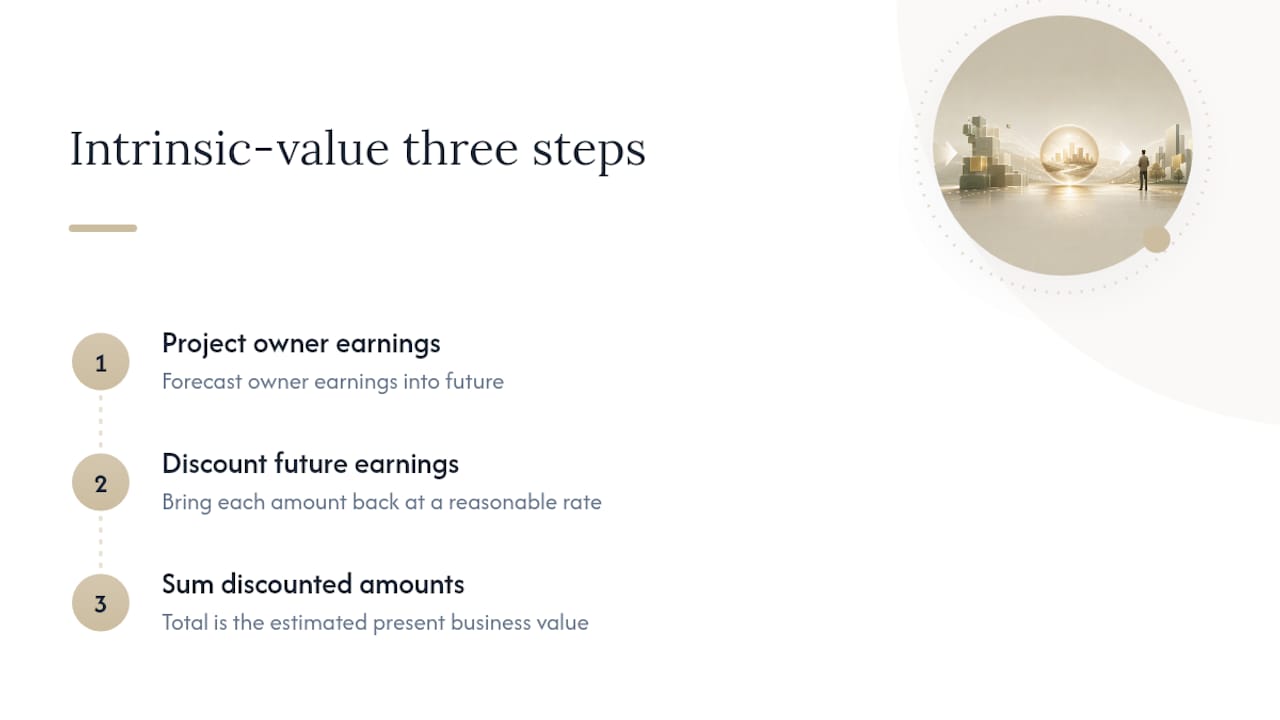
Owner earnings also plug directly into a simplified intrinsic value calculation: project owner earnings forward, discount them back at a reasonable rate, and sum the result to estimate what the business is worth today rather than what the market currently prices it at.
Comparing that yield against enterprise value multiples adds a useful second check before committing capital.
What Are the Limitations of Owner Earnings?
The biggest weakness is that maintenance capex is always an estimate, never a reported fact. Two analysts can look at the same company and land on meaningfully different owner earnings figures depending on which estimation method they choose.
Watch for these traps:
- Seasonality and one-off spikes. A single strong or weak quarter annualized into a "run rate" can mislead badly, since owner earnings run rate calculations are unreliable for businesses with irregular or seasonal results.
- One-time gains or losses. Asset sales, litigation settlements, or restructuring charges can distort a single year's net income and should be normalized out.
- Owner compensation distortions. In privately held companies, owner salary that runs above or below market rate can meaningfully skew the earnings base before you even start adding back non-cash items.
Pro Tip: Never trust a single year's owner earnings number in isolation. Cross-check it against a multi-year average and against reported free cash flow. If the two tell wildly different stories, dig into the footnotes before you draw any conclusion.
How Does Oracle Investments Speed Up Owner Earnings Analysis?
Running this calculation by hand across dozens of companies gets tedious fast, which is exactly the gap Oracleinvestments closes. The app pulls prefilled financials for over 260 stocks, so the net income, D&A, and capex figures you'd otherwise dig out of filings are already sitting there.
That setup lets you:
- Reproduce the worked example above in a fraction of the time, without hunting through cash flow statements.
- Compare owner-earnings yield across companies side by side, rather than one spreadsheet at a time.
- Save notes and scores that feed directly into a broader earnings quality check before you commit to a thesis.
What Do Students Get Wrong About Owner Earnings?
The mistake I see most often: using a single year's capex instead of an average, which makes lumpy reinvestment cycles look like permanent trends. Second mistake: skipping the footnotes, where one-off charges and owner-compensation quirks hide. Third: treating one metric as gospel instead of cross-checking it. Run the calculation on five different companies before you trust your instincts on any of them.
— Matt
A Faster Way to Calculate Owner Earnings
Manually estimating maintenance capex across a dozen companies eats an entire weekend. Oracleinvestments turns that weekend into minutes by pulling the net income, depreciation, and capex figures straight from prefilled financials, then running the owner-earnings math for you across its full stock coverage.

Instead of rebuilding the same spreadsheet for every ticker on your watchlist, you get instant owner-earnings figures and side-by-side comparisons scored against Buffett-style fundamentals. That's the practical difference between spending an afternoon on one company and screening twenty in the same time. Head to the Oracle Investments landing page to see your first comparison run.
Sources
- Owner earnings — Wikipedia
- Owner Earnings Run Rate Explained: Definition, Benefits, and Drawbacks — Investopedia
This article is general information, not a substitute for advice from a qualified financial advisor. Consult a qualified financial professional about your own circumstances before acting on anything here.