
A stock scoring system converts multiple financial and market signals, things like valuation, growth, profitability, and momentum, into one composite score you can use to rank and size positions. Most systems land on a 0 to 100 scale or a 1 to 5 grade, and the reading is simple once you know the anchor points: a higher score generally flags a stronger candidate worth a closer look, moderate scores suggest holding or watching, and low scores indicate the need to investigate potential issues before buying.
Investors lean on these systems for three jobs:
- Screening a universe of hundreds or thousands of stocks down to a shortlist worth researching.
- Ranking candidates against each other inside a sector or the broader market.
- Sizing positions, giving higher scores more portfolio weight and capping or avoiding weak ones.
A score is not a buy signal on its own. It's a triage tool that tells you where to spend your research time first.
Key Takeaways
A reliable stock scoring system combines percentile-normalized fundamentals with disqualifying thresholds, then gets validated through rolling out-of-sample backtests before any live use.
| Point | Details |
|---|---|
| Score is a triage tool | Use it to screen and rank, then confirm with deeper research before sizing a position. |
| Five pillars matter most | Value, growth, quality, financial health, and momentum each catch different risks. |
| Disqualifiers prevent blind spots | Cap the score when one pillar fails badly, even if the composite looks strong. |
| Backtest with realistic constraints | Include transaction costs and out-of-sample periods, and recalibrate at least quarterly. |
| Oracle Investments automates the rubric | Scores over 260 stocks across the same five pillars with real-time updates and side-by-side comparisons. |
This article is general information, not a substitute for advice from a qualified financial advisor. Consult a qualified financial professional about your own circumstances before acting on anything here.
Table of Contents
- How Different Stock Rating Systems Are Built
- Which Metrics Actually Belong in a Stock Grading System
- Setting Weights and Building the Composite Score
- Where Technical Indicators Fit in a Scoring Model
- How to Test Whether a Scoring System Actually Works
- Building Your Own Scoring Rubric Step by Step
- The Discipline Most Scorers Skip
- Try the Same Rubric Inside Oracle Investments
- Sources
How Different Stock Rating Systems Are Built
Not every scoring model works the same way, and picking the wrong framework for your workflow wastes more time than it saves. Four designs show up repeatedly across commercial and academic tools.
- Letter grade bands (A through F). Each pillar, value, growth, quality, gets a letter grade, and the grades combine into an overall rating. Easy to scan, but the coarseness hides differences between a high B and a low A.
- 0-100 composite scores. Trade Ideas' SCoRE blends technical and fundamental inputs into a single 30 to 100 rating updated in real time, with 90+ treated as excellent and 80 to 89 as good. The granularity is useful for ranking, but a single number can mask which pillar is actually driving the result.
- Multi-pillar scorecards with sub-scores. Analystock keeps six pillars, Value, Growth, Quality, Momentum, Volatility, and Dividend Yield, visible alongside the blended total. You see the composite and the components that built it.
Normalization matters as much as the framework itself. A raw P/E of 25 means something different for a software company than for a utility, so most serious systems rank stocks against sector peers using percentiles rather than comparing raw numbers across the whole market. If you only need a fast gut check, a letter-grade system is fine. If you're building a watchlist you'll actually trade against, a granular pillar scorecard gives you more to diagnose when a score changes.
Which Metrics Actually Belong in a Stock Grading System
The metrics you choose determine whether your score reflects real business quality or just noise. Five pillars cover almost everything that matters.
Value metrics tell you what you're paying relative to earnings, cash flow, or assets: price to earnings (P/E), EV/EBITDA, price to free cash flow, free cash flow yield, and price to book (P/B). Cheap on one of these and expensive on another is common, which is why you score value as a blend, not a single ratio.
Growth metrics capture trajectory: revenue CAGR over 3, 5, and 10 year windows, EPS growth, and cash-flow growth. Multi-year windows matter because a single strong quarter tells you almost nothing about durability.
Quality and profitability metrics separate businesses with real competitive advantages from those riding a cycle: return on invested capital (ROIC), gross margin, operating margin, and accrual-based signals similar to the Piotroski framework that flag earnings quality problems before they show up in the price.
Financial health metrics catch the risk that a great valuation or growth number can hide: leverage ratios, current ratio, interest coverage, and the stability of free cash flow across at least a few years, not just the trailing twelve months.
Momentum and market signals round it out: 3, 6, and 12-month returns, relative strength versus sector peers, and volume spikes that hint at institutional accumulation or distribution.
- Always score peer-relative, not absolute, for value and quality metrics, since sector norms vary enormously between, say, banks and biotech.
- Reserve absolute thresholds for financial health checks, where a current ratio under 1 or negative interest coverage is a red flag regardless of sector.
Pro Tip: Pull ROIC and free cash flow stability together before you even look at valuation. A cheap stock with deteriorating cash flow is a value trap, not a bargain, and catching that early saves you from chasing a falling knife.
For a deeper look at how ROIC and margin decomposition feed the quality pillar, see this DuPont analysis breakdown, and for the mechanics behind cash flow metrics, this free cash flow explainer is worth bookmarking.
Setting Weights and Building the Composite Score
Turning five pillars of raw metrics into one number requires two decisions: how to normalize each metric, and how much weight each pillar gets.
Normalization usually takes one of three forms:
- Percentile ranks within a sector or universe (a stock in the 90th percentile for ROIC beats 90% of its peers).
- Z-scores, which measure how many standard deviations a metric sits from the peer average.
- Bucketed ranks, sorting stocks into quintiles or deciles per metric for a simpler, coarser read.
Weighting philosophy splits investors into three camps. Equal-weighting each pillar (20% each across five pillars) is the simplest and hardest to argue with if you have no strong evidence favoring one factor. Evidence-weighted models lean on backtest results, tilting more heavily toward whichever pillars have historically separated winners from losers in a given market regime. Investor-tilt weighting simply reflects your own philosophy, a value investor might weight the value pillar at 35% and momentum at 10%.
Disqualifiers matter more than most new scorers realize. Seeking Alpha's system applies weighted factor grades alongside disqualifying thresholds, so a stock with a strong overall composite can still get capped if one pillar, say profitability, falls below a hard floor. This stops a single strong factor from masking a genuine red flag, like a company with great momentum but negative free cash flow. Build at least one disqualifier into your own rubric: a rule that caps the score if financial health falls into the bottom decile, no matter how attractive everything else looks.

Missing data is common with smaller caps. The cleanest fix is to either exclude the stock from ranking entirely or impute using the sector median, flagged clearly so you know it's an estimate, not a reported figure.
Where Technical Indicators Fit in a Scoring Model
Fundamentals tell you what a business is worth. Technicals tell you what the market currently thinks it's worth, and blending the two well means avoiding redundancy, not stacking more indicators on top of each other.
A handful of technical signals earn a place in most hybrid scoring models:
- Momentum windows (1, 3, 6, and 12 months), the same horizons used in fundamental momentum scoring but calculated purely from price.
- Relative strength versus a sector index or peer group, isolating whether a stock is outperforming its category, not just the market.
- Relative volume spikes, which often precede institutional buying or selling before the price fully reflects it.
- Moving-average location (price relative to its 50 and 200 day averages), a simple trend filter.
The redundancy trap is real: if your fundamental momentum metric already uses 6-month price returns, and you add RSI on top, you're weighting the same underlying signal twice under two different names. Trade Ideas' SCoRE treats its composite as a prefilter rather than a stand-alone trade trigger, and that framing is worth borrowing. Use technicals to confirm or time an entry into a fundamentally strong stock, not to replace the fundamental work.
For weight ranges, keep technicals to 10 to 20% of a long-term investment score, and reserve a separate, higher-weighted technical track (40% or more) for short-term trading models where price action genuinely drives outcomes over days or weeks.
How to Test Whether a Scoring System Actually Works
A scoring system that hasn't been backtested is a hypothesis, not a tool. Four steps separate a rigorous validation from a curve-fit fantasy.
- Avoid look-ahead bias. Only use data that would have been available on the score date, not restated financials or metrics that weren't published yet.
- Use rolling out-of-sample testing. Build the model on one period, test it on a period it never saw, and repeat across multiple windows rather than trusting a single backtest run.
- Include realistic transaction costs. Slippage and spreads on smaller-cap names can erase an edge that looks strong on paper.
- Report the right metrics. Hit rate (percentage of top-scored stocks that outperformed), median and mean forward returns, Sharpe ratio, maximum drawdown, and portfolio turnover all matter more than a single headline return number.
Run sensitivity checks on your weights too. A risk-adjusted returns framework is a useful reference for choosing which metrics actually separate skill from noise.
Pro Tip: Recalibrate quarterly at minimum, but watch for regime shifts, a model tuned during a low-rate bull market can misfire badly once rates or sector leadership change.
Track how your own portfolio responds to score changes over time using a portfolio performance tracking method built for exactly this kind of ongoing check.
Building Your Own Scoring Rubric Step by Step
You don't need institutional infrastructure to build a workable stock evaluation system. Three tooling paths cover almost every investor's needs.
A spreadsheet template works for a watchlist of 20 to 50 stocks, with one row per stock and columns for each raw metric, its percentile rank, and the weighted pillar score. A Python and pandas pipeline scales to hundreds of names and can pull data automatically. Public templates, like the rule-and-weight approach in this open-source stock scoring repository, are a reasonable starting point to adapt rather than build from scratch. For most individual investors, though, an app like Oracle Investments does this work without requiring you to maintain a data pipeline at all.
Whichever path you choose, your rubric needs five fields per metric to stay organized and explainable:
| Field | Purpose |
|---|---|
| Metric name | The specific ratio or figure being scored (e.g., EV/EBITDA) |
| Normalization method | Percentile, z-score, or bucketed rank |
| Pillar | Which of the five pillars the metric feeds into |
| Weight | Percentage contribution to the pillar score |
| Score bucket | The range that defines strong, neutral, or weak |
Before you trust any score, run a quick deployment checklist: confirm your data source is current and free of restatement errors, filter out illiquid stocks that won't fill orders cleanly, and connect your final scores to an actual watchlist so the work translates into decisions. FilingsIQ's automated SEC filings parsing can meaningfully cut the time it takes to extract clean fundamental data if you're building a pipeline yourself. And if a spreadsheet feels like more upkeep than you want, a comparison of stock analysis apps is worth a look before you commit to a build.
The Discipline Most Scorers Skip
Three rules separate investors who use scoring systems well from those who get burned by them. First, never size a position on score alone, treat a high score as permission to research deeper, not permission to buy immediately. Second, a score that drops sharply between updates deserves more attention than one that's simply low, sudden deterioration usually means something changed in the business, not the model. Third, never let one pillar's strength excuse a disqualifying weakness elsewhere, that's exactly the trap threshold rules exist to prevent.
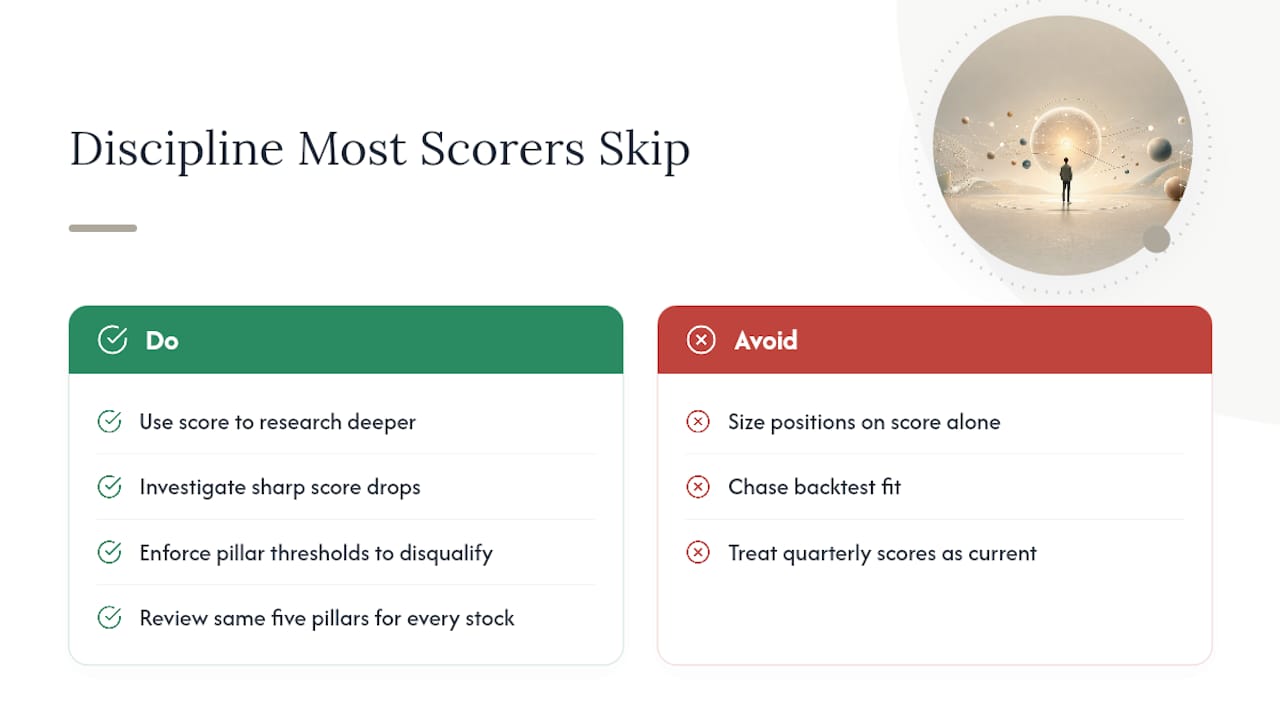
The most common mistake isn't a bad metric choice. It's chasing backtest fit, tuning weights until historical returns look great, then discovering the model falls apart the moment market leadership rotates. A scoring model built during a growth-led bull run often fails outright in a value-led correction. The second most common mistake is treating a quarterly-updated score as current three months later, when the underlying business has already reported two quarters of new information.
Scoring systems work best as a discipline, not a shortcut. They force you to look at the same five pillars for every stock, which is more than most individual investors do on their own.
— Matt
Try the Same Rubric Inside Oracle Investments
Building the spreadsheet above by hand works, but it takes hours per week to keep current across a real watchlist. Oracleinvestments runs the same five-pillar logic, profitability, valuation, growth, and financial health, across more than 260 stocks, updating scores as new filings and price data come in so you're not stuck rechecking numbers manually every quarter.

The app layers in something a raw spreadsheet can't: investment principles drawn from Warren Buffett, Charlie Munger, and Peter Lynch built directly into how each pillar gets interpreted, so a high quality score comes with context, not just a number. Side-by-side comparisons let you rank candidates from your watchlist against each other instantly, and real-time portfolio tracking means your sizing decisions reflect current scores, not last month's. If you've been running the rubric above by hand, try Oracle Investments and see how the same pillars look when they update themselves.