
Profitability ratios are defined as financial metrics that measure how efficiently a company generates profit relative to its sales, assets, or shareholders' equity. These ratios are the foundation of profitability ratios explained in any serious stock analysis course or investment framework. They normalize raw profit numbers so you can compare a $2 billion retailer to a $200 million software firm on equal footing. Investors and students who understand these metrics gain a direct window into a company's pricing power, cost discipline, and overall financial health. The five ratios that matter most are Gross Profit Margin, Operating Profit Margin, Net Profit Margin, Return on Assets (ROA), and Return on Equity (ROE).
What are the main types of profitability ratios?
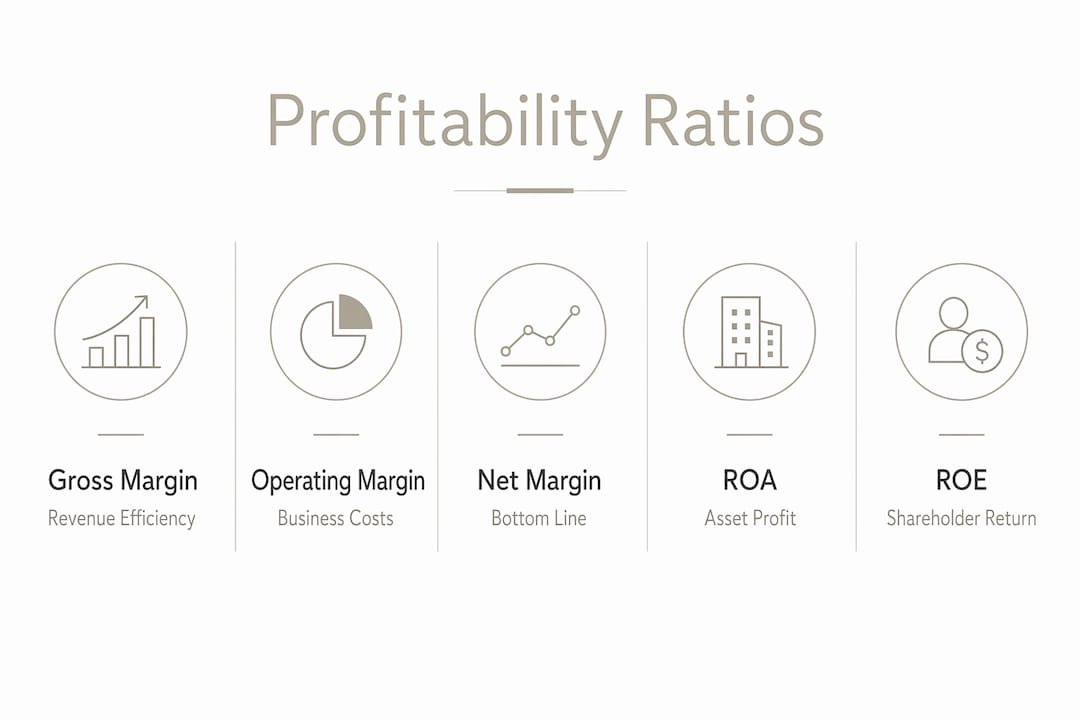
The five critical profitability ratios for stock analysis each measure a different layer of a company's earnings. Together, they form a complete picture of financial performance from the top of the income statement down to the balance sheet.
1. Gross profit margin
Gross Profit Margin shows how much revenue remains after subtracting the direct cost of goods sold (COGS). The formula is: (Gross Profit / Revenue) × 100. A company with $1 million in revenue and $600,000 in COGS has a gross margin of 40%. This ratio tells you how efficiently a company produces or sources its products before any overhead enters the picture.

2. Operating profit margin
Operating Profit Margin goes one step further by subtracting operating expenses like salaries, rent, and marketing from gross profit. The formula is: (Operating Income / Revenue) × 100. This ratio reveals whether a company can run its day-to-day operations profitably, not just sell products at a markup.
3. Net profit margin
Net Profit Margin is the bottom line. The net profit margin formula is: (Net Income / Revenue) × 100. It accounts for everything, including interest payments, taxes, and one-time charges. A 35% net margin means the company keeps $0.35 for every $1.00 of revenue it generates. This is the ratio most often quoted in earnings reports.
4. Return on assets (ROA)
ROA measures how effectively management uses the company's total assets to produce profit. The formula is: (Net Income / Average Total Assets) × 100. Using average assets, calculated as (Beginning Assets + Ending Assets) / 2, smooths out balance sheet fluctuations across the reporting period.
5. Return on equity (ROE)
ROE answers the question every shareholder cares about: how much profit did the company generate from my investment? The formula is: (Net Income / Average Shareholders' Equity) × 100. Warren Buffett consistently cites ROE as one of his preferred measures of management quality.
| Ratio | Formula | Data Source |
|---|---|---|
| Gross Profit Margin | (Gross Profit / Revenue) × 100 | Income statement |
| Operating Profit Margin | (Operating Income / Revenue) × 100 | Income statement |
| Net Profit Margin | (Net Income / Revenue) × 100 | Income statement |
| Return on Assets (ROA) | (Net Income / Avg. Total Assets) × 100 | Income statement + balance sheet |
| Return on Equity (ROE) | (Net Income / Avg. Shareholders' Equity) × 100 | Income statement + balance sheet |
Margin ratios live entirely on the income statement. Return ratios pull from both the income statement and the balance sheet. That distinction matters when you are gathering data for your analysis.
How do profitability ratios help investors assess company performance?
Profitability ratios help investors compare companies by revealing operational efficiency, pricing strategies, and returns to shareholders. They turn raw dollar figures into percentages, which makes cross-company and cross-industry comparisons meaningful.
Here is how investors and analysts put these ratios to work:
- Benchmarking against peers. A 15% net margin means little without knowing whether competitors average 8% or 25%. Ratios only tell a story when placed alongside industry norms.
- Spotting efficiency trends. Comparing a company's ratios over three to five years shows whether management is improving cost control or losing pricing power.
- Evaluating pricing strategy. A rising gross margin with a falling operating margin signals that overhead costs are growing faster than the business can manage.
- Identifying warning signs. A sudden drop in ROA while net income stays flat often means the company is loading up on assets without generating proportional returns.
- Assessing shareholder value. A consistently high ROE, above 15% for most industries, suggests management allocates capital well.
Pro Tip: Always compare a company's ratios to its own five-year average before comparing to peers. A business recovering from a downturn may show ratios that look weak in isolation but strong relative to its own history.
Profitability ratios also serve as early warning systems. A company can report growing revenue while its operating margin quietly erodes. Investors who track key profitability metrics catch that erosion before it shows up in a headline earnings miss.
What are common misconceptions when interpreting profitability ratios?
The biggest mistake investors make is reading a ratio without context. High margins alone do not guarantee quality if they are driven by underinvestment in key areas of the business. A company that slashes its R&D budget will show an improved operating margin in the short term. That same company may lose its competitive edge within two to three years.
Watch out for these common pitfalls:
- One-time income events. A company that sells a division books a large gain that inflates net income and net margin for that quarter. That gain is not recurring, so the ratio overstates true profitability.
- Industry blind spots. A 20% operating margin may be excellent for a retailer but mediocre for a software company. Applying the same benchmark across industries leads to flawed conclusions.
- Using ending balances for ROA and ROE. Many beginners plug in the balance sheet figure from the last day of the year. Using average assets and equity gives a more accurate result because it accounts for changes throughout the full period.
- Ignoring earnings quality. A high net margin built on aggressive revenue recognition or deferred expenses is not the same as one built on genuine cash-generating operations.
Profitability ratios are starting points for fundamental analysis, not final verdicts. They must be paired with qualitative understanding of business strategy, competitive position, and market conditions to produce reliable investment conclusions.
Investors who avoid common ratio mistakes treat these metrics as questions, not answers. A surprisingly high ROE, for example, should prompt you to check whether the company carries heavy debt, since leverage artificially boosts that figure.
How do operating margin and gross margin differ?
Gross margin and operating margin both measure profitability, but they capture it at different stages of the income statement. Understanding operating margin vs gross margin is one of the most practical skills in financial analysis.
Gross margin focuses exclusively on production efficiency. It strips out everything except the direct cost of making or sourcing a product. A clothing brand with a 60% gross margin keeps $0.60 from every dollar of sales before paying a single employee in its corporate office.
Operating margin captures the full cost of running the business. It subtracts salaries, marketing, rent, depreciation, and all other operating expenses from gross profit. Operating margin measures efficiency after all running costs from core business operations, making it a more complete view of day-to-day profitability.
| Metric | What it includes | What it excludes |
|---|---|---|
| Gross profit margin | Revenue minus COGS | Operating expenses, taxes, interest |
| Operating profit margin | Revenue minus COGS and operating expenses | Taxes, interest, one-time items |
The gap between gross margin and operating margin is revealing. A wide gap means the company spends heavily on overhead relative to its production costs. A narrow gap means it runs a lean operation. Operating margin condenses quality and efficiency of core operations by focusing on income before interest and taxes but after all operating expenses.
Pro Tip: When comparing two companies with similar gross margins, check their operating margins next. The one with a higher operating margin is controlling overhead more effectively, which usually translates to stronger long-term profitability.
Software companies routinely show gross margins above 70% because their marginal cost of delivering another unit of software is near zero. Their operating margins, however, vary widely based on how aggressively they invest in sales and engineering. That contrast is exactly why you need both numbers.
Key Takeaways
Profitability ratios measure how efficiently a company converts revenue, assets, and equity into profit, and they require industry context to produce reliable investment conclusions.
| Point | Details |
|---|---|
| Five core ratios | Gross Margin, Operating Margin, Net Margin, ROA, and ROE cover every layer of profitability. |
| Context is required | A 20% operating margin is strong in retail but weak in software; always benchmark against industry peers. |
| Use average balances | ROA and ROE calculations should use average assets and equity, not year-end figures alone. |
| Watch for one-time items | Asset sales and accounting adjustments inflate ratios without reflecting true recurring profitability. |
| Margin gap reveals overhead | The spread between gross and operating margin shows how efficiently a company manages its operating costs. |
What I have learned from years of reading profitability ratios
Ratios seduce you with their simplicity. You see a 40% net margin and think you have found a great business. I have made that mistake, and it cost me time and money.
The ratio is only the first question. The real work starts when you ask why. Why is this margin so high? Is it pricing power, cost discipline, or a one-time accounting event? A company like a capital-light software firm and a capital-heavy manufacturer can both report 20% net margins, but the underlying business quality is completely different.
My practical advice for investors who are newer to this: start with operating margin. It cuts through the noise of financing decisions and tax strategies. It shows you what the core business actually earns. Then layer in ROE to see how well management compounds shareholder capital over time. Read the margin of safety concept alongside these ratios, because a great margin means nothing if you overpay for the stock.
Ratios are a language. The more companies you read, the faster you recognize when a number sounds wrong. That pattern recognition takes time, but it starts with understanding what each ratio actually measures.
— Matt
How Oracleinvestments puts profitability ratios to work for you
Knowing the formulas is one thing. Applying them across hundreds of stocks in real time is another challenge entirely.

Oracleinvestments scores over 260 stocks based on key financial fundamentals including profitability, valuation, and financial health. The platform translates raw ratio data into clear value ratings so you can assess a company's profitability standing without building a spreadsheet from scratch. You can read a value rating in under a minute and compare companies side by side instantly. Whether you are a student building your first watchlist or an experienced investor screening for undervalued opportunities, Oracleinvestments gives you the analytical depth of a professional toolkit in a format that is fast and clear.
FAQ
What are profitability ratios?
Profitability ratios are financial metrics that measure how efficiently a company generates profit from its revenue, assets, or equity. The five most commonly used are Gross Profit Margin, Operating Profit Margin, Net Profit Margin, ROA, and ROE.
What is the net profit margin formula?
The net profit margin formula is: (Net Income / Revenue) × 100. A result of 35% means the company retains $0.35 in profit for every $1.00 of revenue after all expenses, taxes, and interest.
What is operating margin and how does it differ from gross margin?
Operating margin measures profit after both production costs and operating expenses, while gross margin only subtracts the direct cost of goods sold. Operating margin gives a fuller picture of how efficiently a company runs its core business.
Why do profitability ratios need industry context?
A 20% operating margin is strong in retail but below average in software, where margins often exceed 30%. Comparing ratios without industry benchmarks leads to misleading conclusions about a company's true performance.
How do you calculate ROA and ROE accurately?
Use average assets or equity, calculated as (Beginning Balance + Ending Balance) / 2, rather than the year-end figure alone. This approach accounts for balance sheet changes throughout the full reporting period and produces a more accurate result.