
The price to earnings ratio, or P/E, is a company's share price divided by its earnings per share. It answers one question fast: how much are you paying for $1 of that company's profit? A high number means investors expect more growth ahead; a low number often means the opposite, or that something's wrong. Two variants matter most:
- Trailing P/E uses actual earnings from the past 12 months.
- Forward P/E uses analysts' earnings estimates for the year ahead.
Both answer slightly different questions, and mixing them up is one of the most common mistakes new investors make.
Key Takeaways
The price to earnings ratio only tells you something useful when you compare it against peers, history, and complementary metrics like PEG and EV/EBITDA.
| Point | Details |
|---|---|
| Formula basics | P/E equals share price divided by diluted EPS, which itself equals net income divided by diluted shares outstanding. |
| Trailing vs. forward | Trailing P/E uses actual past earnings; forward P/E relies on analyst estimates and shifts as forecasts change. |
| Context beats the raw number | A P/E only means something next to industry medians, historical averages, and the broader market range. |
| Know the failure points | Negative earnings, one-time items, buybacks, and cyclical peaks can all distort what P/E appears to show. |
| Pair it with other checks | Oracle Investments scores 260+ stocks on valuation and fundamentals, making it easier to compare P/E and PEG side by side. |
Table of Contents
- Understanding the price-to-earnings ratio formula
- Trailing P/E vs. forward P/E: which one should you trust?
- How to calculate P/E step by step, with real numbers
- Reading a P/E number: high, low, or just normal for the sector
- Where the price to earnings ratio breaks down
- A quick checklist for using P/E before you buy
- Why one ratio never tells the whole story
- Compare valuation multiples faster with Oracle Investments
- Where to verify the numbers yourself
- Sources
Understanding the price-to-earnings ratio formula
The math is simple. Price to earnings ratio equals share price divided by earnings per share, and Investor as net income divided by shares outstanding. You can also skip the per-share step entirely: divide the total market capitalization by total net income, which Wall Street Prep notes produces the same result when the share count hasn't changed.
- Pull net income from the income statement.
- Divide by diluted shares outstanding to get diluted EPS.
- Divide the current share price by that EPS figure.
Diluted EPS accounts for stock options, convertible bonds, and other instruments that could turn into new shares. It's almost always lower than basic EPS, and it's the number serious investors default to because it doesn't overstate profitability.
Pro Tip: A P/E of 15 can be read as "15 years of current earnings to pay back your purchase price," assuming profits never grew. That framing, explained in detail on Wikipedia's P/E entry, is why investors tolerate much higher multiples on companies expected to grow fast.
Trailing P/E vs. forward P/E: which one should you trust?
Trailing P/E, sometimes labeled TTM (trailing twelve months), uses real, reported earnings. Nobody can revise history, so SmartAsset calls it the more objective of the two. Forward P/E swaps in analyst estimates for the next 12 months, which makes it forward-looking but also vulnerable to guesswork.
- Trailing P/E is stable and verifiable, but it can look outdated right before an earnings shift.
- Forward P/E captures where a company is headed, but estimates get revised, sometimes sharply, as new guidance comes in.
- Normalized or adjusted P/E strips out one-time gains or losses to show a cleaner picture.
- Rolling average P/E smooths out multiple years for cyclical businesses whose profits swing with the economy.
If you're checking whether a stock has already run too hot, trailing P/E gives you the honest, unadjusted answer. If you're trying to gauge whether today's price makes sense given what's coming, forward P/E is the better lens, provided you remember it's built on someone's forecast, not fact.
How to calculate P/E step by step, with real numbers
Start with the two inputs every P/E calculation needs: net income and shares outstanding, both of which live in a company's 10-K and 10-Q filings on SEC EDGAR. Public filings, not headlines or summary sites, are the reliable source for these figures.
Here's a walkthrough using a hypothetical company:
- Net income for the trailing 12 months: $500 million.
- Diluted shares outstanding: a hypothetical figure for illustration. This follows the diluted EPS approach outlined in academic accounting materials, which treats diluted EPS as the more conservative, and more useful, figure.
- Diluted EPS: $500 million ÷ 250 million shares = $2.00 per share.
- Current share price: a hypothetical figure for illustration.
- Trailing P/E: share price divided by diluted EPS, producing a ratio.
- Analyst consensus for next year's earnings: an estimated figure for forward-looking EPS.
- Forward P/E: share price divided by forward EPS estimates, producing a ratio.
Pro Tip: When forward P/E is noticeably lower than trailing P/E, the market is pricing in earnings growth. When it's higher, analysts expect earnings to shrink, and that's worth investigating before you buy.
Reading a P/E number: high, low, or just normal for the sector
A P/E of 30 sounds expensive until you realize the company's industry median sits at 35. Context is everything, and there are three comparisons worth running every time.
- Compare to the company's own history. A stock trading at a P/E of 22 when its five-year average is 15 is pricier than usual, for better or worse reasons.
- Compare to industry peers. Software companies routinely trade at higher multiples than grocery chains because investors pay up for growth and capital-light business models.
- Compare to the broader market. Historical S&P 500 P/E ratios have swung between roughly 5 and 44, with long-run averages usually landing somewhere between 10 and 20 depending on how you measure it. A stock trading well above that band deserves a second look at what's driving the premium.
A regulated electric utility at the same multiple would be a red flag, since utilities rarely grow earnings that fast and typically trade in the low teens. The number alone tells you almost nothing; the comparison is where the insight lives.
Where the price to earnings ratio breaks down
P/E stops working the moment earnings turn negative. Divide a share price by a negative or near-zero EPS and you get a meaningless or nonsensical figure, which is exactly why early-stage and loss-making companies get valued on revenue multiples instead.
- Negative or minimal earnings make the ratio unusable; there's no denominator worth dividing by.
- One-time gains, litigation settlements, or asset write-downs can distort a single quarter's EPS and throw off the whole ratio.
- Aggressive share buybacks shrink the share count and mechanically boost EPS, flattering P/E without any real improvement in the business.
- Heavily leveraged companies can show attractive P/E ratios while carrying debt risk the ratio never captures.
- Cyclical businesses, like miners or automakers, look cheap at the peak of their earnings cycle and expensive at the trough, which is the classic setup for a value trap.
Pro Tip: A stock with a suspiciously low P/E isn't automatically a bargain. Check whether earnings are near a cyclical peak or propped up by a one-time item before assuming the market got it wrong.
A quick checklist for using P/E before you buy
- Confirm the EPS source and use diluted EPS, not basic EPS, for a more conservative number.
- Compare the current P/E to the industry median and the stock's own historical range.
- Adjust for one-off items and, for cyclical companies, use rolling multi-year average earnings.
- Pair the P/E ratio with PEG to account for growth, and check EV/EBITDA if debt levels look heavy.
- If the multiple still looks off, dig into the most recent earnings call for context on management's own explanation.
Why one ratio never tells the whole story
P/E is a starting point, not a verdict. On its own, it can't tell you whether a company's growth justifies its price or whether a "cheap" stock is cheap for a reason. Pairing it with PEG accounts for growth rate, and EV/EBITDA strips out the noise of differing debt loads and tax situations, something P/E completely ignores.
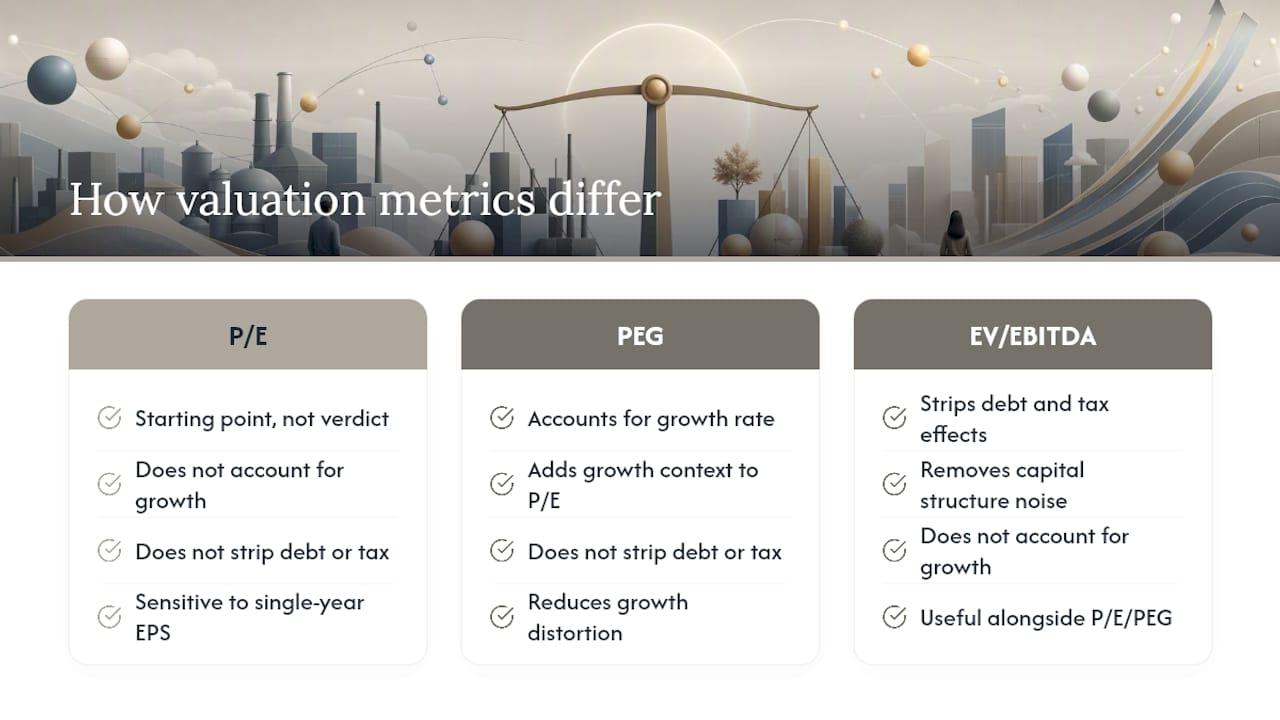
For cyclical businesses, I'd rather look at a rolling four or five-year average EPS than a single trailing twelve months. One strong or weak year skews the ratio in a way that misleads more than it informs. Tools that let you compare valuation scores across companies quickly save real time here, since running PEG and EV/EBITDA by hand for every stock on a watch list gets tedious fast.
None of this makes P/E less useful. It just means treating it as one input among several, not the whole analysis.
Compare valuation multiples faster with Oracle Investments
Running P/E, PEG, and EV/EBITDA by hand across a watch list of even ten stocks eats up an evening. Oracle Investments scores over 260 stocks on fundamentals like profitability, valuation, and financial health, so you see how a company's P/E stacks up against its peers without pulling filings yourself.

The app pulls in valuation multiples alongside growth and quality metrics, letting you spot a potentially undervalued stock or catch a value trap before it costs you money. It also builds on investing frameworks associated with Warren Buffett, Charlie Munger, and Peter Lynch, so the scoring reflects principles that have held up across market cycles, not just a single quarter's numbers. If you're ready to see how your current watch list scores on P/E and beyond, start comparing stocks with Oracle today.
Where to verify the numbers yourself
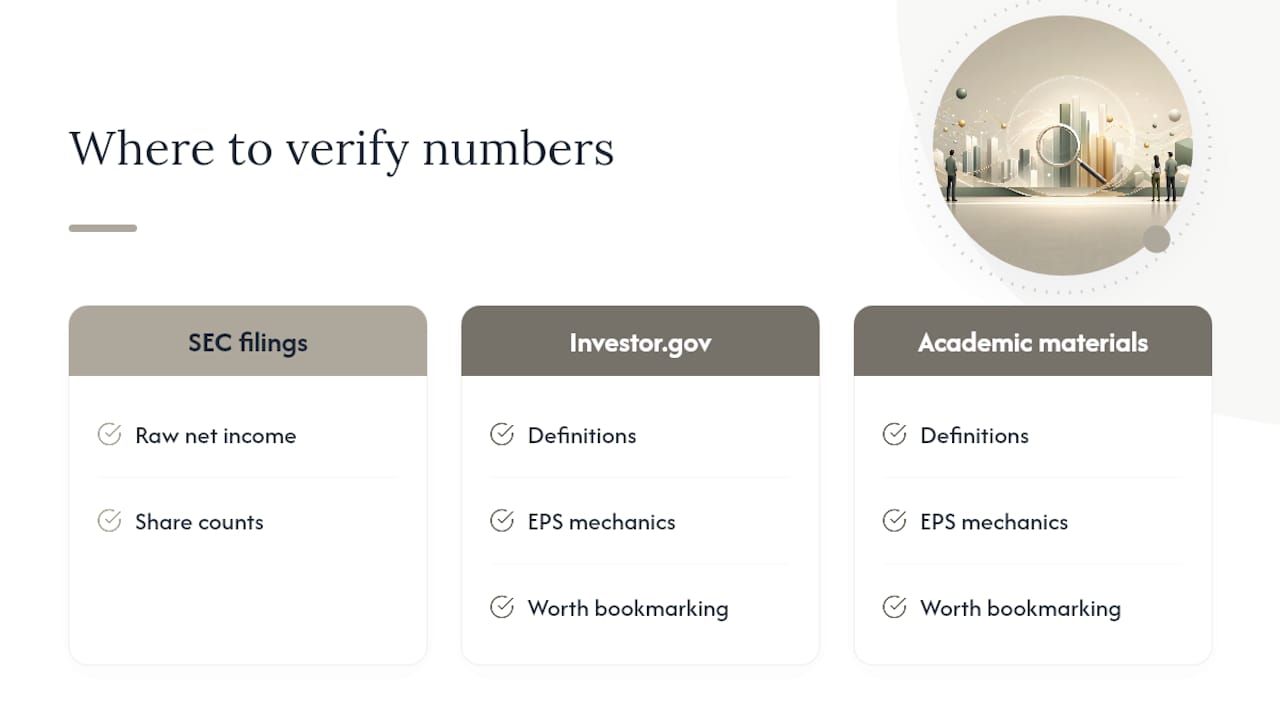
For raw net income and share counts, go straight to a company's SEC filings. For definitions and EPS mechanics, Investor.gov and academic accounting materials both offer clear, no-nonsense explanations worth bookmarking.
Sources
- Investor
- P/E Ratio (Price-Earnings) | Wall Street Prep
- Forward P/E vs Trailing P/E
- SEC company search