
Peter Lynch's investing strategy comes down to this: notice what works in your daily life, classify the business behind it, then verify the story with a few simple numbers, PEG, P/E, debt, inventory, before you buy. It's a long-term, bottom-up approach built on evidence, not hunches. Start today by writing a one-sentence story about a company you already understand, then run it through a short financial checklist before you commit a dollar.
TL;DR:
- Proper verification is essential; only after confirming that the company's financials support your observation should you consider investing.
- Classify stocks into one of six categories—fast growers, stalwarts, slow growers, cyclicals, turnarounds, or asset plays—to determine appropriate valuation and patience levels.
- Use the PEG ratio as a quick check, ensuring it is near one or below, but remember it is unreliable for companies with unstable or negative earnings.
- Focus on key financial signals such as manageable debt, inventory growth aligned with sales, and consistent free cash flow to catch problems early.
- Modern tools like investment scoring platforms can significantly streamline Lynch-style analysis by providing instant fundamental comparisons across many stocks.
Table of Contents
- Why "Invest in What You Know" Is a Starting Point, Not a Buy Signal
- The Six Stock Categories and How to Classify a Company
- Key Financial Checks and Valuation Shortcuts Lynch Used
- How to Apply Lynch's Process From Idea to Buy Decision
- When to Sell, Position Sizing, and Risk Management
- Adapting Lynch for Today: Modern Signals and Faster Checklists
- Examples of Successful Investments Made Using Lynch's Strategy
- Common Pitfalls or Criticisms of Lynch's Approach
- How Lynch's Strategy Compares to Other Famous Investing Styles
- Author Perspective: Applying Lynch's Rules to a Real Observation
- How Oracle Investments Speeds Up Lynch-Style Research
- Sources
Why "Invest in What You Know" Is a Starting Point, Not a Buy Signal
Lynch built his reputation at Fidelity's Magellan Fund, which he ran from 1977 to 1990, on the idea that ordinary people spot good businesses before Wall Street does, as long as they follow up with real analysis. His mantra was never "buy your favorite store." It was closer to "let your favorite store point you toward a company, then go check the numbers," a distinction confirmed in Investopedia's profile of Lynch.
Familiarity gives you a hypothesis, nothing more. Say a regional sandwich chain near your office suddenly has a line out the door every day for three months. That's an observation. Before it becomes an investment, you need to know:
- Whether the parent company is public and what percentage of revenue that chain actually represents
- Whether same-store sales are growing or the growth is coming purely from new locations
- Whether margins are expanding or getting squeezed by labor and food costs
- Whether the balance sheet can fund expansion without taking on dangerous debt
Skip that step and you're not investing. You're gambling on a hunch with better lighting.
The Six Stock Categories and How to Classify a Company
Lynch sorted every stock into one of six buckets, and the Validea breakdown of his strategy shows why this matters more than most beginners realize: each category calls for its own valuation logic and its own patience level. Judge a cyclical the way you'd judge a fast grower and you'll overpay right before the cycle turns.
- Fast growers: small to midsize companies growing earnings at a high rate annually. Signal: accelerating revenue, expanding store count or user base, room left to grow.
- Stalwarts: large, steady companies growing at a moderate annual rate. Signal: reliable earnings, brand strength, modest but consistent PEG.
- Slow growers: mature, often dividend-paying companies growing at a low annual rate. Signal: you're buying the yield and stability, not upside.
- Cyclicals: auto, airline, steel, and similar businesses tied to economic swings. Signal: earnings and P/E move in opposite directions, so buy when the P/E looks high and the cycle is bottoming.
- Turnarounds: companies recovering from serious trouble. Signal: improving cash position, debt being paid down, a credible new plan.
- Asset plays: companies sitting on assets, real estate, cash, patents, that the market is undervaluing. Signal: hidden value not reflected in the earnings statement.
Pro Tip: Reclassify a stock every time you review it. A fast grower that slows to single-digit growth for two straight years has quietly become a stalwart, and your valuation math needs to change with it.
Key Financial Checks and Valuation Shortcuts Lynch Used
The PEG ratio is Lynch's signature shortcut: divide the P/E ratio by the expected earnings growth rate. A PEG near or under 1 suggests the stock's price is reasonable relative to its growth; a PEG well above 2 usually means you're overpaying for that growth. The SnowballHare rundown of Lynch's approach is blunt about its limits, though: PEG breaks down for companies with negative or wildly unstable earnings, and it can be gamed by one-off items, buybacks, or recent acquisitions that distort the numbers. Always check whether you're comparing trailing or forward figures. Our PEG ratio guide walks through the calculation with real examples if you want the mechanics spelled out.
By the numbers: Lynch's own checklist, as compiled by Validea, centers on inventory growth relative to sales, conservative debt levels, and strong free cash flow, three signals that catch trouble long before it shows up in the headline earnings number.
Beyond PEG, run through these before buying:
- Debt-to-equity should be reasonable for the industry, not just "low" in isolation.
- Inventory growing faster than sales is an early warning sign, especially in retail.
- Free cash flow should track or exceed reported net income over multiple years.
- Heavy insider buying is a positive tell; heavy insider selling deserves scrutiny.
- Thin analyst coverage isn't a red flag on its own. Lynch actually preferred it, since it meant less competition for the idea.
How to Apply Lynch's Process From Idea to Buy Decision
Turning an observation into a position takes a repeatable process, not a gut call.
- Capture the idea. Write down what you noticed and why it's interesting in one sentence.
- Classify the business into one of the six categories above. This decision drives every valuation step that follows.
- Write a one-paragraph company story: what it sells, why demand exists, and what could make that demand disappear.
- List three earnings drivers and test each one against the company's latest quarterly filing or 10-K.
- Calculate a normalized PEG and P/E, adjusting for one-off items, buybacks, or recent acquisitions, a step SnowballHare recommends specifically because raw numbers mislead so often.
- Set an explicit invalidation condition: the one fact that, if it happens, proves your thesis wrong.
- Size the position based on category risk, smaller for cyclicals and turnarounds, larger for stalwarts you understand deeply.
Pro Tip: Write the invalidation condition before you buy, not after the stock drops 20%. Deciding what would prove you wrong while you're calm is the entire difference between a plan and a rationalization.
Our step-by-step beginner stock analysis guide covers the core ratios and chart checks that pair well with this process if you want a second pass on the fundamentals.
When to Sell, Position Sizing, and Risk Management
Lynch sold when the story broke, not when the stock price wobbled. Watch for these triggers:
- The original earnings drivers stop showing up in quarterly results.
- Debt climbs or inventory outpaces sales for two or more consecutive quarters.
- The valuation runs far ahead of the growth rate that justified buying it.
- A turnaround stalls with no improving cash trend after several quarters.
Size positions to match category risk. Stalwarts and proven fast growers can carry more weight; cyclicals, turnarounds, and asset plays deserve smaller stakes until the thesis proves out. Lynch also stressed patience with real winners, the "tenbagger" concept he popularized rests on holding a great business for years while the story stays intact, a point SnowballHare makes central to his legacy. Cut the losers that break your thesis; let the ones that keep delivering keep running. For a broader framework on managing risk as your portfolio matures, this risk management guide is worth a read.
Adapting Lynch for Today: Modern Signals and Faster Checklists
The line-out-the-door edge Lynch relied on has mostly evaporated. Information moves too fast now for a crowded parking lot to be a secret, a point raised in Kiplinger's take on buying what you know, which argues investors need to swap physical observation for digital proxies.
- For SaaS businesses, watch annual recurring revenue and net retention instead of foot traffic.
- For retail and consumer brands, compare same-store sales and review-site sentiment trends.
- For e-commerce, website traffic and search-interest trends serve the same function old-school store visits once did.
Modern research also suggests that once an edge is visible to everyone, it's already priced in, which is exactly why the follow-up verification step matters more today than it did in 1985.
This is where a tool like Oracle Investments earns its keep: it scores stocks on profitability, valuation, and financial health side by side, compressing several Lynch-style checks into one screen instead of five separate spreadsheets.
Examples of Successful Investments Made Using Lynch's Strategy
Lynch's most famous calls came from exactly the pattern described above: notice, classify, verify, then hold. Dunkin' Donuts is the classic case, Lynch reportedly became curious about the company after enjoying the coffee on a personal trip, then followed up by digging into the financials before Fidelity built a position that became one of Magellan's standout winners over the following years. The pattern repeats across his career: an everyday observation triggers curiosity, then unglamorous work with the balance sheet and income statement decides whether the idea survives.
Taco Bell fits the same mold. Lynch noticed the chain's growing footprint and pricing power in everyday life, then verified that unit economics and same-store sales actually backed up what he was seeing on the ground, treating it as a fast grower with room to keep expanding. La Quinta Inns followed a similar arc as a steady, understandable business trading at a valuation that didn't reflect its growth.
None of these worked because Lynch liked the coffee or the tacos. They worked because the observation survived contact with the numbers, revenue growth held up, debt stayed manageable, and the earnings story kept confirming itself quarter after quarter. That's the actual lesson buried in these stories: the anecdote is memorable, but the spreadsheet is what made the money. Anyone retelling a Lynch success story while skipping the financial verification step is telling half the story, and it's the less important half.
Common Pitfalls or Criticisms of Lynch's Approach
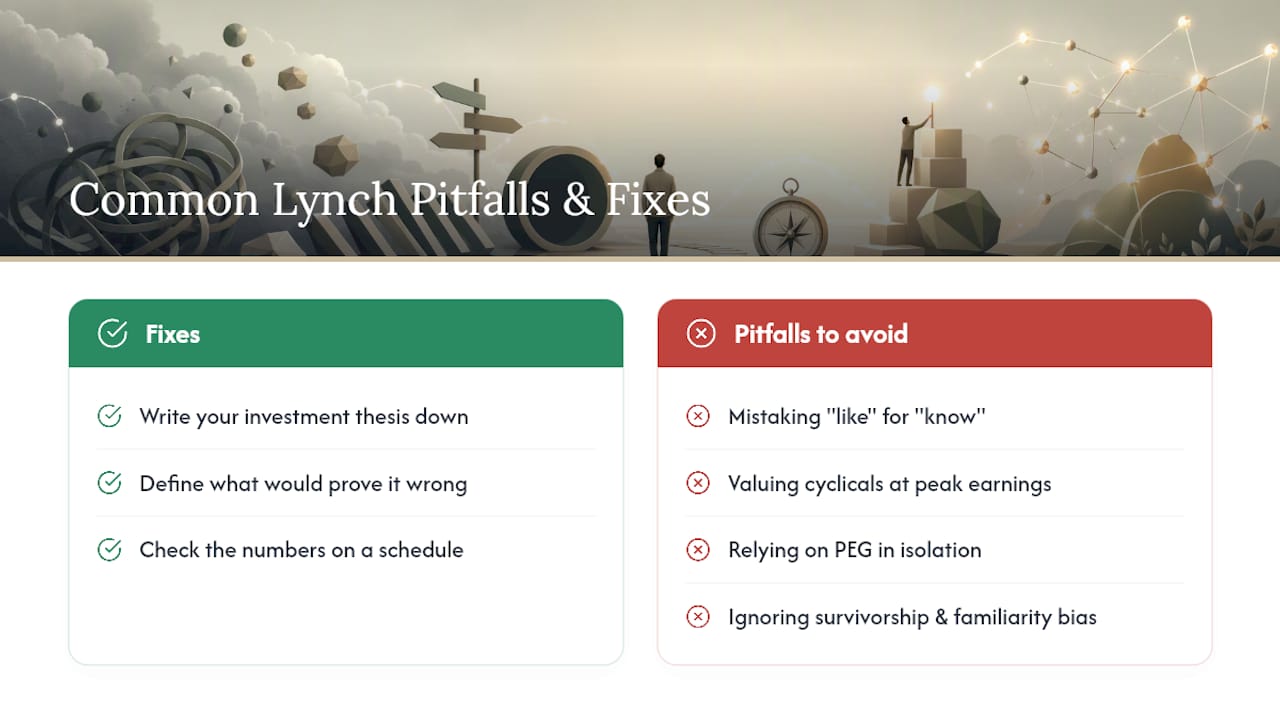
The biggest criticism of Lynch's method is that "invest in what you know" gets misquoted as "invest in what you like," and that substitution has cost plenty of investors real money. Liking a product tells you nothing about margins, debt, or competitive threats. Commentary from 24/7 Wall St. points out that Lynch's quote is routinely stripped of the analytical half that made it work in the first place.
A second pitfall is category mismatch: valuing a cyclical stock at peak earnings as though it were a fast grower, which is exactly when the P/E looks deceptively cheap right before earnings collapse. A third is overreliance on PEG in isolation. It's a useful screen, not a verdict, and it fails outright for companies with negative or erratic earnings.
There's also a survivorship bias problem in how Lynch's record gets told. Stories emphasize the tenbaggers and skip the positions that went nowhere or lost money, which flatters the method more than the full record probably supports. And familiarity bias cuts both ways: knowing a company well can mean genuine insight, or it can mean emotional attachment that keeps you holding a broken thesis past the point a stranger would have sold. The fix for all of this is the same one Lynch himself pushed: write the thesis down, define what would prove it wrong, and check the numbers on a schedule instead of on a feeling. Our guide to common value investing mistakes covers several of these traps in more detail.
How Lynch's Strategy Compares to Other Famous Investing Styles
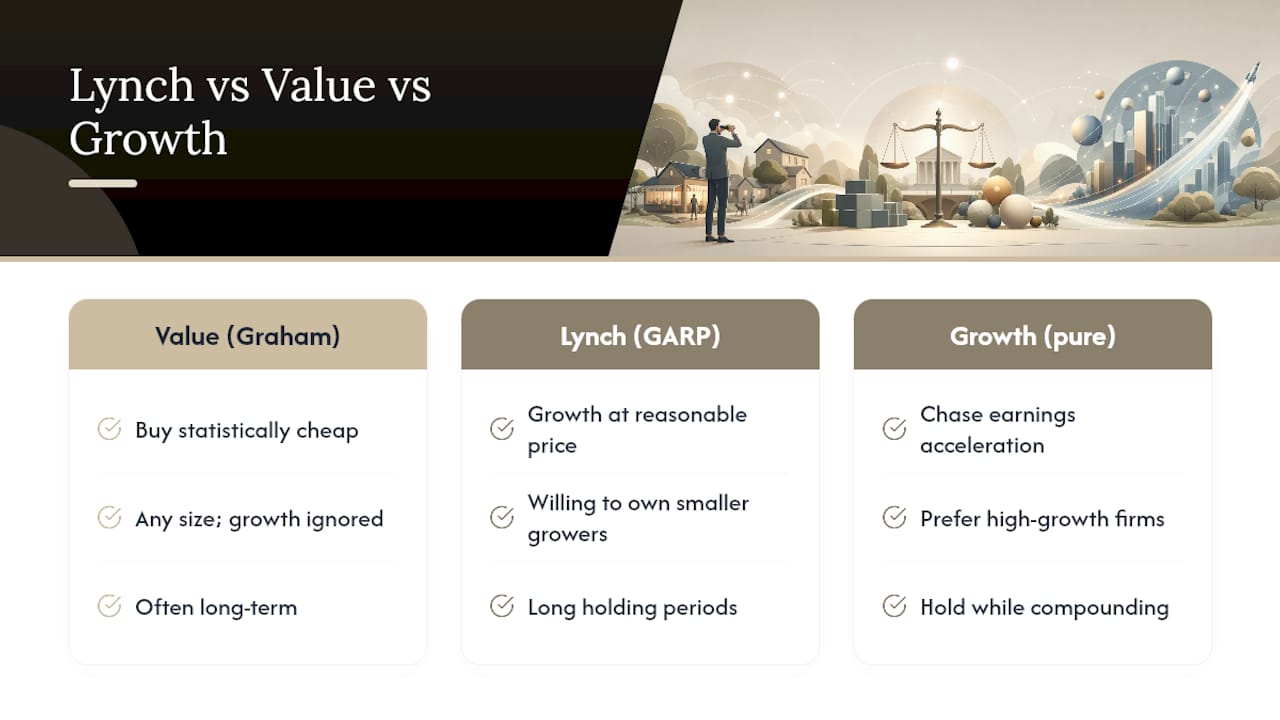
Lynch's approach sits closer to Warren Buffett's than most people assume, both favor understandable businesses, conservative debt, and long holding periods, but Lynch was far more willing to own smaller, faster-growing companies and to hold dozens or even hundreds of positions at once. Buffett concentrates in a handful of businesses he's willing to hold indefinitely. Lynch, running a mutual fund with billions in assets, diversified broadly and let a smaller percentage of huge winners carry the portfolio.
Lynch's method is often described as GARP, growth at a reasonable price. It places him between two extremes. Deep value investors in the Benjamin Graham tradition look for statistically cheap stocks regardless of growth, sometimes buying businesses with little momentum simply because assets exceed the market price. Pure growth investors chase earnings acceleration and often ignore valuation almost entirely, willing to pay steep multiples for a story that keeps compounding. Lynch wanted both: real growth and a price that didn't already assume perfection. Our GARP investing guide breaks down how that middle path gets applied in practice.
The practical takeaway for individual investors is that no single style, Lynch's, Buffett's, or Graham's, works in every market environment. Lynch's framework earns its popularity because it's built around a repeatable process rather than a single metric, which makes it easier to apply consistently even when growth stocks or value stocks happen to be out of favor.
Author Perspective: Applying Lynch's Rules to a Real Observation
A few years back, I noticed a regional grocery chain expanding aggressively near several neighborhoods I knew well. The observation was easy. The verification wasn't: same-store sales growth turned out to be thin, and debt had climbed faster than revenue to fund the expansion. I passed. That's the unglamorous part of Lynch's method nobody markets: most ideas get rejected, and the ones that survive the checklist are the only ones worth a position. Keep a running watchlist and revisit it when new numbers come out. Evidence changes; your position should too.
— Matt
How Oracle Investments Speeds Up Lynch-Style Research
Running Lynch's checklist by hand, pulling debt ratios, checking inventory trends, comparing PEG across a handful of candidates, eats an entire evening for one stock. Oracle Investments is built for exactly that bottleneck: it scores more than 260 stocks on profitability, valuation, and financial health, then lets you compare candidates side by side instead of juggling spreadsheets across a dozen browser tabs.

The app pulls in the same categories of fundamentals Lynch leaned on, debt levels, cash strength, growth relative to price, and surfaces them instantly rather than making you dig through a 10-K first. It also tracks your portfolio in real time, so re-evaluating a position when the story changes takes seconds instead of a weekend. If you want to see how your own watchlist scores against Lynch's checklist, check out Oracle Investments and run your first comparison today.
Sources
- Who Is Peter Lynch? — Investopedia
- The Investment Strategy of Peter Lynch — Validea
- Peter Lynch investment strategy: stock categories, PEG ratio & tenbaggers — SnowballHare
- Buy what you know — Kiplinger