
A quality of earnings (QofE) analysis measures how much of a company's reported earnings are sustainable, recurring, and backed by actual cash flows. If you're evaluating a deal, reviewing a portfolio holding, or assessing credit risk, that distinction is the difference between paying a fair price and overpaying for accounting.
Here's where to start:
- Pull three years of financial statements, the general ledger, and bank statements before anything else.
- Compare operating cash flow to net income for each period. A persistent gap is your first red flag.
- Identify every item management labels "non-recurring" and test whether it actually is.
- Reconcile reported revenue to cash receipts (proof-of-cash) to confirm the revenue is real.
- Normalize EBITDA by removing owner-specific costs, one-time charges, and accounting distortions.
The sections below cover the core tests, key ratios, a self-audit checklist you can run before commissioning a formal QofE, and practical scope guidance for U.S. deal and portfolio work.
Key Takeaways
High-quality earnings are sustainable, recurring, and supported by operating cash flow. Low-quality earnings are accrual-heavy, management-adjusted, and prone to reversal.
| Point | Details |
|---|---|
| CFO vs. net income gap | A persistent gap between operating cash flow and net income is the single most reliable early signal of low earnings quality. |
| Proof-of-cash priority | Reconciling bank statements to reported revenues and expenses uncovers mismatches that ratio analysis alone will miss. |
| Non-recurring item frequency | Items labeled one-time in multiple consecutive periods are operating costs; include their average in normalized EBITDA. |
| NWC normalization | Establish a trailing twelve-month average NWC peg before closing; window dressing in the final quarter is common and material. |
| Oracleinvestments for screening | Oracleinvestments scores over 260 stocks on profitability, valuation, and financial health, letting analysts flag weak cash metrics and margin shifts before running a full QofE scope. |
Table of Contents
- What are the core components practitioners test in a QofE?
- How is a QofE engagement executed from data request to final report?
- What metrics and ratios measure earnings quality?
- What earnings quality red flags does QofE work typically uncover?
- When should you commission a QofE, and what does it cost in the U.S.?
- A practical checklist you can run before commissioning a formal QofE
- Why proof-of-cash and margin persistence deserve the most attention
- Oracleinvestments brings earnings-quality checks within reach for analysts
- Useful sources for further reading
What are the core components practitioners test in a QofE?
The scope of a QofE maps to the places where GAAP gives management the most discretion. Anders CPA's practitioner guide describes the standard components that appear in virtually every U.S. QofE engagement:
- Accruals analysis: Measure the gap between accrual-based earnings and cash generation. CFA Institute's framework separates reporting quality (faithful representation) from results quality (persistence). High accruals relative to assets signal earnings that tend to mean-revert.
Common EBITDA normalization adjustments
| Adjustment | Typical Direction | Rationale |
|---|---|---|
| Owner/excess compensation | Add back | Compensation above market rate for the role |
| Personal expenses in operating costs | Add back | Non-business costs run through the P&L |
| One-time legal or restructuring charges | Add back | Non-recurring; new owner would not incur |
| Below-market related-party rent | Deduct | Rent must be restated to market rate |
| Revenue from discontinued customer | Deduct | Not part of the go-forward revenue base |
| Non-cash stock compensation | Add back (with judgment) | Non-cash, but consider dilution impact |
| COVID-era grants or PPP forgiveness | Deduct | Non-recurring government benefit |
Pro Tip: Watch closely for "recurring one-offs." If a company has restructuring charges in four of the last five years, those charges are operating reality, not exceptions. Experienced practitioners track the frequency and dollar magnitude of claimed non-recurring items across the full trailing period before accepting any single adjustment.
How is a QofE engagement executed from data request to final report?
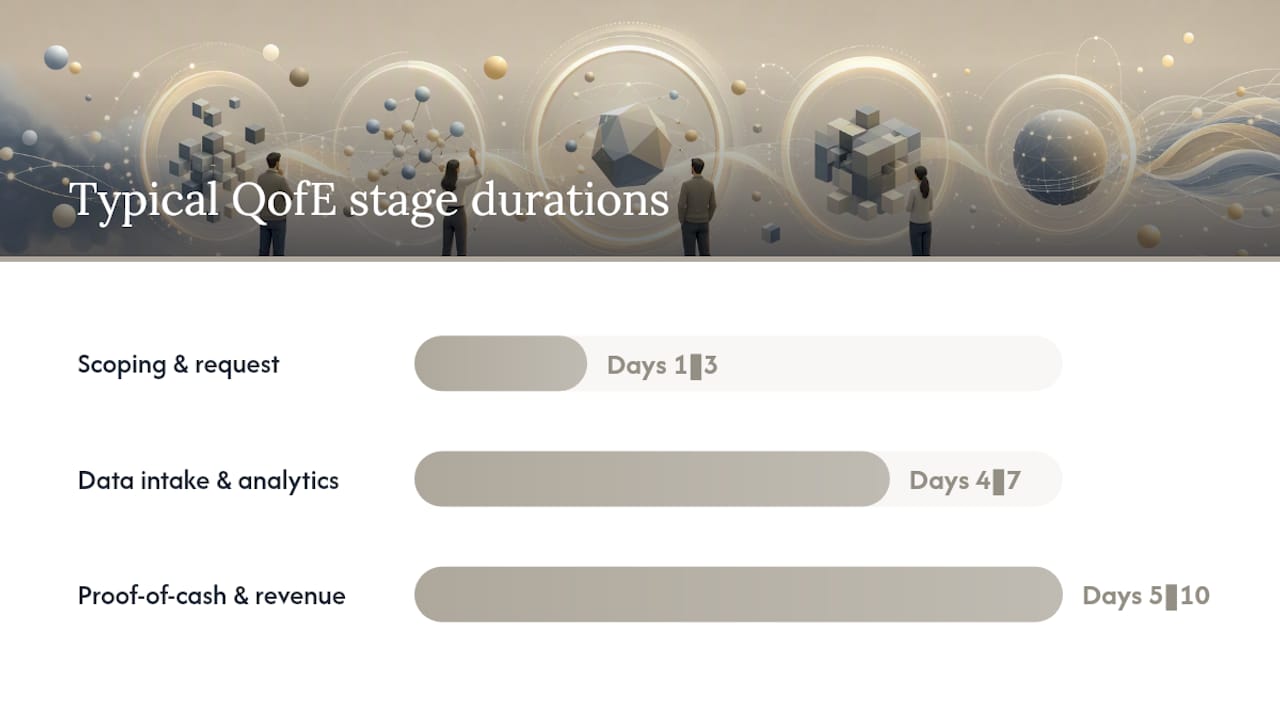
The workflow follows a predictable arc, though data readiness is the single biggest variable in U.S. middle-market deals.
Front-loaded data request (request on day one):
- Three to five years of audited or reviewed financial statements
- Monthly general ledger detail for the trailing twelve months (TTM) and prior two years
- Bank statements and bank reconciliations for all accounts
- Accounts receivable aging reports (current and prior periods)
- Accounts payable aging and vendor listing
- Payroll registers and owner/officer compensation detail
- Customer contracts, revenue schedules, and backlog reports
- Lease agreements and fixed-asset schedules
- Tax returns (federal and state) for the trailing three years
- Debt agreements and covenant compliance certificates
| Stage | Typical Duration | Key Activities |
|---|---|---|
| Scoping and data request | Days 1–3 | Define scope, issue data request, set management interview schedule |
| Data intake and initial analytics | Days 4–7 | Organize GL, run horizontal/vertical analysis, flag anomalies |
| Proof-of-cash and revenue testing | Days 5–10 | Reconcile bank to GL, test revenue timing, confirm cash receipts |
| EBITDA normalization and NWC | Days 8–— | Build adjustment schedule, establish NWC peg, test AR/inventory |
| Management follow-up | Days 10–— | Resolve open items, request supporting documentation |
| Draft report and review | Days —–20 | Prepare adjustment schedules, normalized P&L, risk memo |
| Final report delivery | Days —–— | Deliver final report with valuation implications section |
A scoped review on a clean, well-documented business can close in two to three weeks. A complex multi-entity deal with incomplete records, multiple revenue streams, and related-party transactions routinely runs four to six weeks.
Deliverables a buyer or lender should expect:
- Normalized EBITDA bridge (reported to adjusted, line by line)
- Proof-of-cash reconciliation schedules
- NWC analysis with trailing twelve-month average and proposed peg
- AR aging analysis and collectability assessment
- Risk and valuation implications memo summarizing findings and their deal impact
Documentation standards matter. Every adjustment in the normalized EBITDA schedule should be supported by a specific document (invoice, contract, payroll record) or a management representation that is corroborated by independent evidence. Adjustments supported only by management assertion carry lower credibility with deal teams and lenders.
A note on evidence thresholds: In U.S. deal practice, practitioners typically require documentary support for any adjustment exceeding 5% of reported EBITDA. Smaller adjustments may rely on management representations, but the aggregate of unsupported adjustments should be disclosed separately in the report.
What metrics and ratios measure earnings quality?
Quantitative earnings quality metrics give you a fast read before you commit to a full QofE scope. Financial statement analysis techniques including horizontal, vertical, and ratio analysis form the foundation for detecting trends and comparability issues. Here are the formulas practitioners actually use:
-
QoE ratio (CFO / Net Income): The most direct single measure. Wall Street Prep's formula guide defines it as operating cash flow divided by net income. A ratio above 1.0 signals cash-supported earnings; a ratio persistently below 1.0 warrants investigation. Values near zero or negative while net income is positive are a serious red flag.
-
Accruals ratio (Balance Sheet method): (Net Operating Assets current year − Net Operating Assets prior year) / Average Net Operating Assets. A rising accruals ratio signals earnings growth driven by accruals rather than cash, which CFA Institute research links to lower earnings persistence and higher mean-reversion risk.
-
FCF / EBITDA: Free cash flow divided by EBITDA. Values consistently below 0.5 in a capital-light business suggest either aggressive accrual accounting or hidden cash costs. For capital-intensive businesses, adjust for normalized capex before drawing conclusions. You can explore free cash flow measures in more depth to calibrate this ratio by sector.
-
Days Sales Outstanding (DSO): (Accounts Receivable / Revenue) × 365. Rising DSO without a corresponding change in payment terms suggests revenue is being recognized ahead of collection, or that receivables quality is deteriorating.
-
Inventory Turnover: Cost of Goods Sold / Average Inventory. A declining trend in a stable-demand business often signals obsolescence risk or channel stuffing upstream.
-
Gross margin and operating margin trends: Run horizontal analysis across five years. Margin compression that management does not explain in MD&A is a flag. The SEC's guidance on MD&A identifies management's discussion as the primary source for understanding sustainability and material risks. Unexplained margin shifts belong on your follow-up list.
-
Debt / EBITDA and interest coverage: Leverage ratios shift materially when EBITDA is normalized downward. A business that looks comfortably levered at 3.5x reported EBITDA may breach covenant thresholds at 4.8x normalized EBITDA. Interest coverage analysis is worth running in parallel with every EBITDA normalization.
The single most widely used indicator in U.S. deal practice is the CFO-to-net-income gap. When operating cash flow consistently trails net income over a three-year period, the difference is almost always explained by accrual build-up, aggressive revenue recognition, or deferred expense treatment. That gap is where QofE work earns its fee.
Interpretation notes: No single ratio is conclusive. A QoE ratio below 1.0 in a high-growth SaaS company may reflect deferred revenue burn-down, not manipulation. Rising DSO in a business that just shifted to net-60 terms from net-30 is a policy change, not a red flag. Context and trend matter more than any single period's reading. For a deeper look at profitability ratios and how they interact with earnings persistence, that's a useful companion read.
What earnings quality red flags does QofE work typically uncover?
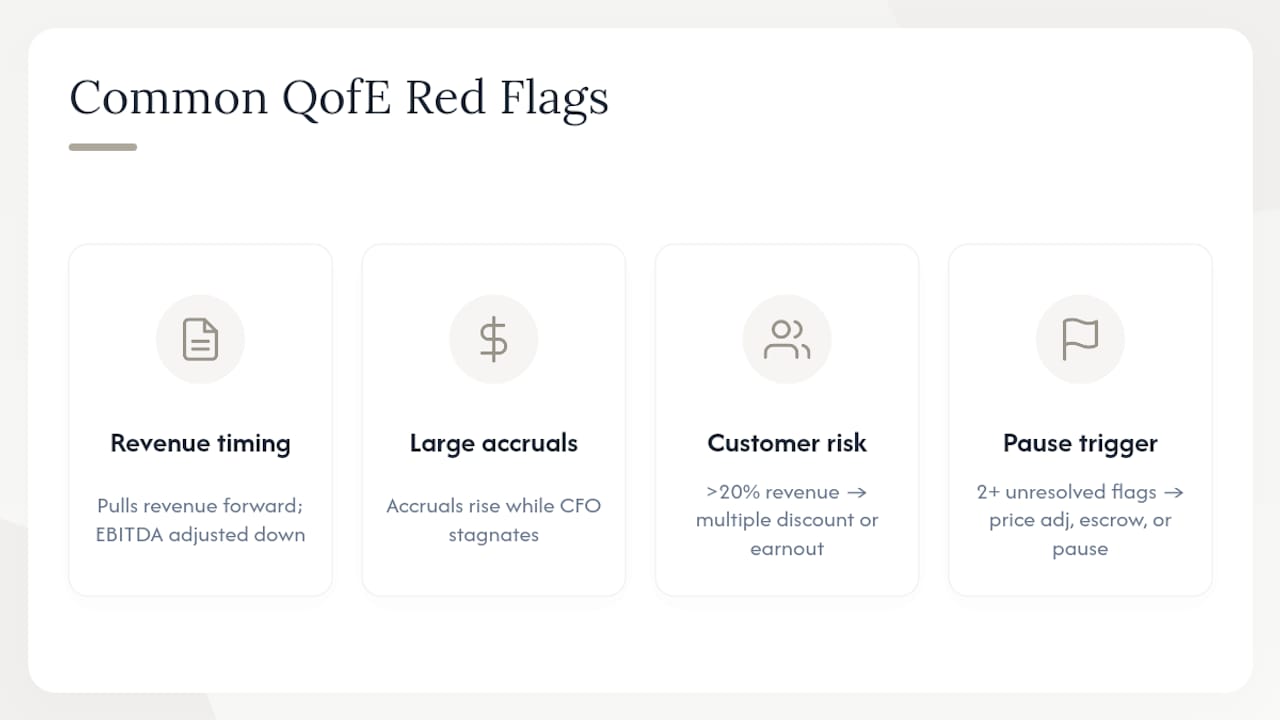
The red flags that surface most often in U.S. QofE work fall into a short list. Each one has a direct valuation consequence.
Revenue recognition timing shifts: Revenue pulled forward through aggressive percentage-of-completion accounting, premature milestone recognition, or bill-and-hold arrangements inflates the current period at the expense of future periods. The valuation impact is a downward EBITDA adjustment and, in severe cases, a restatement risk discount.
Large accruals without cash support: When the accruals ratio rises sharply while CFO stagnates, earnings are growing on paper but not in the bank. This pattern often precedes earnings disappointments and is one of the clearest signals of low persistence in the CFA Institute's reporting quality framework.
Customer concentration: A business where one customer represents more than 20% of revenue carries concentration risk that most buyers price through a multiple discount or an earnout structure tied to retention. The QofE should quantify concentration by customer, contract term, and renewal history.
Unexplained cash transfers: Intercompany transfers, loans to related parties, or unusual cash movements between periods that don't appear in the GL narrative are a fraud indicator. Proof-of-cash catches these because they show up as reconciling items between bank activity and reported figures.
Rapid working capital changes: AR aging that deteriorates sharply in the final quarter, inventory that builds without a corresponding sales increase, or AP that stretches unusually close to a deal date all suggest window dressing. NWC normalization adjusts for these, but the pattern itself raises questions about management's reporting culture.
Unusual related-party transactions: Below-market leases from owner-affiliated entities, management fees paid to holding companies, and intercompany service agreements at non-arm's-length rates distort operating margins. Accounting inconsistencies in lease treatment, as Damodaran's financial statement analysis work notes, can also affect operating income measures used in QofE normalization.
Frequent "non-recurring" items: A company that reports restructuring charges, litigation settlements, or impairments in most trailing periods is signaling that these costs are structural. Buyers should treat the average of trailing non-recurring items as a recurring operating cost for valuation purposes.
When to pause or renegotiate: A single red flag with a clear explanation and documentary support rarely justifies delaying a transaction. Two or more unresolved red flags touching revenue recognition, cash reconciliation, or related-party transactions together warrant either a price adjustment, an escrow holdback, or a deal pause until management provides satisfactory documentation.
When should you commission a QofE, and what does it cost in the U.S.?
The decision to commission a full QofE versus running a scoped internal review comes down to deal size, complexity, and what the preliminary analytics show.
| Scenario | Recommended Approach | Typical U.S. Timeline |
|---|---|---|
| Deal value under $5M, clean books, single entity | Self-run checklist + scoped review | 1–2 weeks |
| Deal value $5M–$50M, moderate complexity | Full QofE by accounting firm or advisory firm | 3–5 weeks |
| Deal value over $50M, multi-entity, complex revenue | Full QofE with extended scope (tax, IT, HR) | 5–8 weeks |
| Portfolio company annual review | Internal QofE-style review | 2–3 weeks |
| Pre-LOI red-flag check | Scoped analytics review | 1 week |
Cost considerations: Fees for a U.S. QofE engagement are driven by scope, entity count, data quality, and the firm's market position. A scoped review on a simple business typically runs in the low tens of thousands of dollars. A full QofE on a mid-market deal commonly falls in the $50,000–$150,000 range. Large, complex engagements with extended scope can exceed $250,000. These are directional ranges, not quotes; actual fees depend on the specific engagement.
The cost of skipping a QofE is almost always higher than the cost of running one. A $75,000 QofE that uncovers $500,000 in EBITDA adjustments on a 7x deal saves $3.5M in purchase price. The math is straightforward.
Scope-decision questions to ask before commissioning:
- Does the preliminary CFO-to-net-income ratio show a persistent gap?
- Are there related-party transactions in the financial statements?
- Has the company changed its revenue recognition policy in the last three years?
- Does the business have customer concentration above 20% in a single account?
- Are there off-balance-sheet commitments or contingent liabilities not reflected in reported debt?
If you answer yes to two or more of these, a full QofE is warranted regardless of deal size.
A practical checklist you can run before commissioning a formal QofE
This checklist covers the highest-signal checks you can run in 30–90 minutes with publicly available or management-provided data, plus the deeper items to include in a formal QofE scope.
Quick checks (30–90 minutes):
- Calculate CFO / Net Income for each of the last three years. Flag any year below 0.8.
- Run a five-year horizontal analysis on revenue, gross margin, and operating margin. Note any year-over-year shift greater than 200 basis points without a clear explanation.
- Calculate DSO for the last four quarters. A rising trend warrants a follow-up on AR aging.
- List every item management labels "non-recurring" in the last three years. Count how many appear in multiple periods.
- Identify all related-party disclosures in the footnotes. Note transaction type, counterparty, and dollar amount.
- Compare reported revenue to cash receipts on the cash flow statement. A growing gap is your proof-of-cash trigger.
- Check the income statement for unusual line items in the final quarter of each year.
Deeper items for a formal QofE scope:
- Full proof-of-cash reconciliation: bank statements to GL to reported revenue and expenses, month by month for the TTM.
- EBITDA normalization schedule: document every adjustment with supporting evidence and the rationale for inclusion.
- NWC normalization: calculate trailing twelve-month average NWC, identify seasonal peaks and troughs, and propose a closing peg.
- AR aging analysis: request aging by customer for the current period and the same period one year prior.
- Inventory reserve analysis: compare reserve levels as a percentage of gross inventory across periods.
- Management interview: ask directly about pending litigation, customer contract renewals, and any known post-period events.
Mini workpaper fields to track:
- Reported EBITDA (period)
- Add-backs claimed by management (itemized)
- Adjustments accepted by analyst (itemized, with support)
- Adjustments rejected (with rationale)
- Normalized EBITDA
- NWC peg (proposed vs. trailing average)
- Open items requiring resolution
Pro Tip: The highest signal-to-effort ratio in deal work comes from the proof-of-cash reconciliation and the non-recurring item frequency test. Both can be run quickly with bank statements and a three-year P&L, and both surface issues that no ratio analysis will catch. Run these two before anything else.
Translating findings to valuation inputs is the final step. Each accepted EBITDA adjustment reduces the multiple base. Each NWC shortfall reduces the closing cash consideration. Document every adjustment with a clear link to the supporting evidence so the deal team or investment committee can trace the logic without asking follow-up questions.
Why proof-of-cash and margin persistence deserve the most attention
Most analysts spend the bulk of their QofE time on EBITDA normalization, and that's understandable. The adjustment schedule is what shows up in the purchase price negotiation. But the normalization exercise is only as good as the revenue it starts from, and that's where proof-of-cash does work that nothing else replicates.
The cases where QofE work has the most impact are almost never the ones where management is obviously misleading anyone. They're the cases where revenue is technically GAAP-compliant but economically premature, where a customer paid a large deposit in December that pulled forward Q4 results, or where a related-party lease is priced at 60% of market and has been that way for so long that nobody flags it anymore. Proof-of-cash catches the deposit. A related-party footnote review catches the lease. Neither shows up in a ratio screen.
Margin persistence is the other underweighted test. Analysts tend to normalize for one-time costs and then accept the resulting margin as representative. The better question is whether the margin is structurally achievable going forward, not just whether it was achieved in the trailing period. A business that hit 22% EBITDA margins during a period of unusually low input costs, deferred maintenance, or below-market compensation deserves a forward-looking margin stress test, not just a trailing normalization.
The practical implication: when time and budget force a trade-off between depth and breadth, prioritize proof-of-cash and a five-year margin trend analysis over a comprehensive checklist of smaller items. The two tests together cover the highest-risk territory in most U.S. deals.
Oracleinvestments brings earnings-quality checks within reach for analysts
Running a full QofE engagement takes weeks and significant budget. But the preliminary screening work, identifying which companies warrant that level of scrutiny, doesn't have to.

Oracleinvestments scores over 260 U.S.-listed stocks across profitability, valuation, and financial health fundamentals, giving analysts a fast read on the metrics that matter most in earnings quality work: cash generation relative to reported earnings, margin trends, and leverage. Instead of building a screening model from scratch, you can compare companies side by side in seconds, flag the ones where cash metrics diverge from reported earnings, and prioritize your deeper diligence accordingly. The app draws on the same investment principles that Warren Buffett, Charlie Munger, and Peter Lynch have applied to earnings sustainability for decades.
For analysts who run QofE checks regularly, Oracleinvestments works as a front-end filter: surface the candidates with weak cash support or deteriorating margins, then commit the full QofE scope to the ones that need it. Start screening stocks on Oracleinvestments and see which holdings in your portfolio or deal pipeline deserve a closer look.
Useful sources for further reading
| Source | Best For | Type |
|---|---|---|
| CFA Institute: Evaluating Quality of Financial Reports | Reporting quality vs. results quality framework; accrual persistence theory | Foundational / academic |
| CFA Institute: Quality of Earnings — A Critical Lens | Proof-of-cash procedures; QofE scope in M&A and PE | Practitioner guide |
| Anders CPA: QoE Report Guide | Typical QoE procedures, adjustments, and deliverables | Practitioner guide |
| Wall Street Prep: QoE Ratio Formula | CFO / Net Income formula and interpretation | Practical reference |
| SEC: Beginner's Guide to Financial Statements | MD&A disclosure; management's view of sustainability and material risks | Primary / regulatory |
| Investopedia: Financial Statement Analysis | Horizontal, vertical, and ratio analysis techniques | Practical reference |
| Analyst Mastery: CFA Level II Reporting Quality | Accrual persistence; comparability adjustments; decision-dependent analysis | Academic / exam prep |
| NYU Stern (Damodaran): Financial Statement Analysis | Lease and R&D accounting adjustments; operating income normalization | Academic / technical |
This article is for general informational purposes only and does not constitute financial, accounting, or legal advice. Confirm current accounting standards, regulatory requirements, and deal-specific considerations with a qualified professional.