
Earnings call analysis is the systematic process of reviewing a company's quarterly financial conference call to extract insights about its business health, management confidence, and stock valuation potential. Every quarter, publicly traded companies host these calls to discuss results with analysts and investors. The S&P 500 saw nearly 30% EPS growth year over year in Q2 2026, with 85% of companies beating expectations. That scale of market activity makes knowing how to interpret these calls one of the most practical skills an investor can build. Oracleinvestments scores over 260 stocks on fundamentals like profitability, valuation, and financial health, giving investors a structured starting point before they ever dial in.
What is an earnings call and what does it contain?
An earnings call is a live conference call held by a public company each quarter, typically within a few weeks of the period's end. The CEO, CFO, and sometimes other senior executives present results and take questions from Wall Street analysts. The call is open to the public and recorded, so individual investors can listen live or read the transcript afterward.
The structure of a typical earnings call follows a predictable pattern:
- Prepared remarks: Management walks through revenue, net income, operating margins, and cash flow. They frame the numbers with context about market conditions and internal execution.
- Financial highlights: The CFO covers specific line items, including gross margin trends, capital expenditures, and debt levels.
- Strategic updates: Leadership discusses product launches, geographic expansion, acquisitions, or cost reduction programs.
- Forward guidance: Management provides revenue and earnings estimates for the next quarter or full year. This section carries the most weight for stock valuation.
- Analyst Q&A: Sell-side analysts ask pointed questions. The quality and candor of answers here often reveals more than the prepared remarks.
The earnings call differs from the official earnings report, which is a formal SEC filing like the 10-Q or 10-K. The report contains audited financials. The call adds color, context, and the human element of management judgment. Both matter, but the call is where narrative meets numbers.
How to analyze earnings calls step by step
Effective earnings call analysis follows three distinct phases: preparation before the call, active listening during it, and structured review afterward.

Pre-call preparation sets the baseline. Pull the earnings press release and any investor presentation slides the company posts before the call begins. Note the consensus estimates from analyst forecasts so you know what the market expected. Review the previous quarter's call transcript to track what management promised and whether they delivered.
During the call, focus on four things simultaneously:
- Revenue and margin performance: Did the company beat or miss on revenue? Did gross margins expand or compress? A revenue beat with margin compression often signals pricing pressure or rising costs.
- Cash flow and debt: Net income can be managed through accounting choices. Free cash flow is harder to manipulate. Check whether cash generation supports the dividend, buybacks, or growth investment.
- Forward guidance: Future guidance drives valuation more than past results. A company that beats Q2 but lowers Q3 guidance will almost always see its stock fall.
- Management tone: Listen for hesitation, unusual qualifiers, or changes in language compared to prior calls. Confidence in delivery often signals confidence in the business.
Post-call review is where most individual investors underinvest their time. Read the full Q&A transcript. Note which analyst questions management deflected or answered vaguely. Key metrics to track include revenue growth rate, operating margin direction, free cash flow conversion, debt-to-equity trends, and guidance revision history. A thorough review typically takes one to two hours per call.
Pro Tip: Build a simple spreadsheet that captures five core metrics from each call: revenue growth, gross margin, free cash flow, guidance midpoint, and one qualitative note on tone. After four quarters, patterns become obvious.
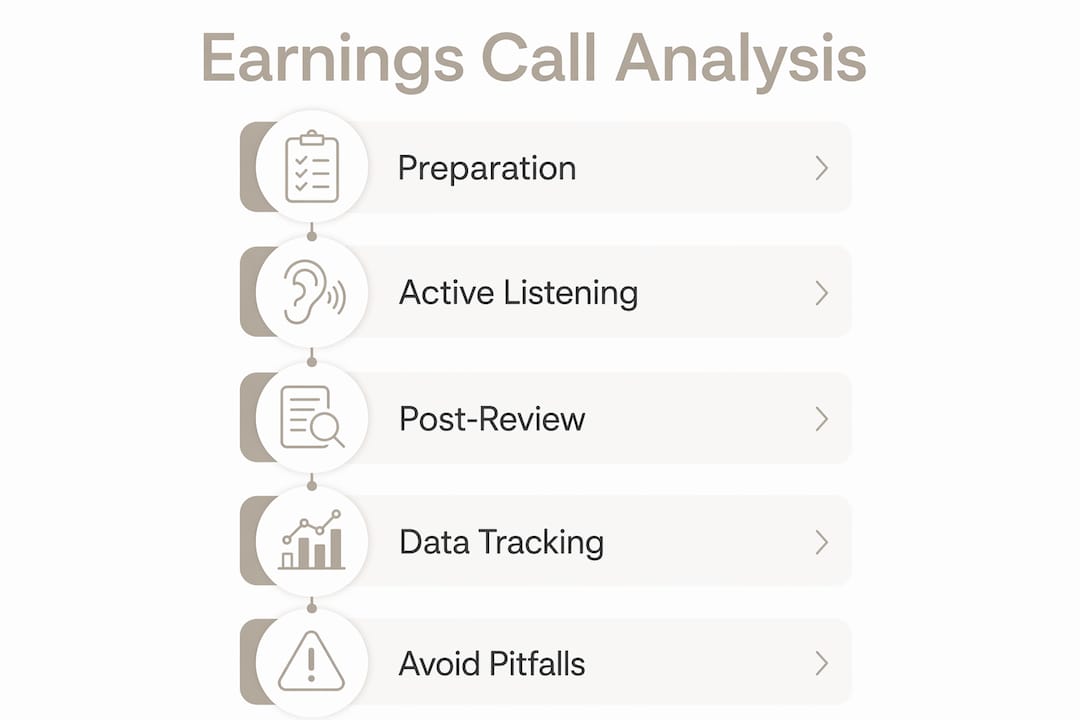
Common pitfalls include fixating on the headline EPS number, ignoring guidance changes, and failing to compare the call against prior quarters. Reading value investing mistakes that beginners make can sharpen your discipline before you start.
How does management tone reveal what the numbers don't?
Management language is a data source that most individual investors ignore entirely. Sentiment divergence in earnings calls is often a better predictor of future stock volatility than the reported financial metrics. When executives grow cautious in their language while the numbers still look strong, that divergence frequently precedes a guidance cut or earnings miss in the following quarter.
Specific signals to watch include:
- Increased hedging language: Phrases like "we expect" replacing "we will" or "we anticipate" replacing "we are confident" signal a shift in internal outlook.
- Shorter prepared remarks: When management spends less time on strategy and more time on near-term execution, it often means the long-term story has weakened.
- Deflected analyst questions: If the CFO repeatedly redirects margin questions to revenue growth, the margin story is probably deteriorating.
- Changes in guidance framing: Linguistic analysis of transcripts shows that keyword shifts comparing current calls to historical ones reveal optimism or caution before those sentiments appear in reported numbers.
Forward guidance is the single highest-impact section of any call for valuation purposes. Lowering guidance after a beat typically causes significant stock price declines because investors price stocks on future earnings, not past ones. ASML, for example, reported strong net income in Q2 2026 but the market's reaction centered almost entirely on its Q3 revenue guidance range.
Pro Tip: Compare the exact phrasing management uses for guidance across three consecutive calls. Subtle word changes, not just the numbers, often telegraph a shift in business momentum weeks before it shows up in results.
Seasoned analysts use linguistic software to detect these subtle language shifts before they appear in reported numbers. Individual investors can replicate this manually by keeping a transcript log and reading calls side by side.
How do you build bull and bear cases from an earnings call?
Every earnings call contains the raw material for both a bull and a bear investment thesis. The analyst Q&A section is where these debates surface most clearly. Recurring questions from multiple analysts on the same topic signal that the market has identified a key risk or opportunity that needs resolution.
The most common debate topics in earnings calls include:
- Growth sustainability: Is revenue growth driven by pricing, volume, or one-time factors? Pricing-driven growth is harder to sustain.
- Margin trajectory: Are margins expanding because of operating leverage, or are cost cuts masking underlying weakness?
- Capital allocation: Is management buying back stock, paying dividends, or investing in growth? Each choice signals a different view of the company's future.
- Competitive pressure: When management avoids discussing competition directly, analysts probe harder. The evasion itself is informative.
- Regulatory and macro risk: Companies operating in regulated industries often face questions about policy changes. How management frames these risks reveals their preparedness.
Building balanced bull and bear cases requires focusing on revenue drivers, margin potential, and the specific risks raised during the Q&A. The bull case rests on what management confirmed with evidence. The bear case rests on what they avoided, qualified, or left unresolved.
Use these cases to set a valuation range rather than a single price target. If the bull case implies a stock is worth $150 and the bear case implies $90, and the stock trades at $130, the risk-reward is asymmetric to the downside. That framing directly informs position sizing and portfolio decisions. Learning how to read a value rating sharpens this process by anchoring your thesis to fundamental scoring.
Why tracking earnings call trends across quarters matters
A single quarterly earnings review tells you where a company stands today. Tracking calls across multiple quarters tells you where it is heading. Longitudinal analysis of earnings calls provides greater predictive insight than any individual call can deliver on its own.
The table below shows the key dimensions to track across quarters and what changes in each dimension typically signal:
| Dimension | What to track | What a change signals |
|---|---|---|
| Revenue growth rate | Quarter-over-quarter and year-over-year | Acceleration or deceleration in demand |
| Gross margin | Percentage and direction | Pricing power or cost pressure |
| Free cash flow | Conversion rate from net income | Earnings quality and capital efficiency |
| Guidance revision | Up, flat, or down versus prior quarter | Management confidence in the outlook |
| Management tone | Language shifts in prepared remarks | Early warning of business momentum change |
Quarterly earnings calls remain the primary venue for communicating long-term strategy, even amid ongoing debate about whether quarterly reporting creates short-term thinking. That debate does not change the practical reality: the calls happen, and the investors who analyze them systematically hold a clear informational edge over those who only read the headline numbers.
AI tools now automate transcript analysis at scale, flagging sentiment shifts and keyword changes across hundreds of calls simultaneously. Individual investors without access to enterprise platforms can still apply the same logic manually by maintaining a consistent tracking framework across four to eight quarters per company.
Key Takeaways
Earnings call analysis delivers its greatest value when applied consistently across multiple quarters, not as a one-time event.
| Point | Details |
|---|---|
| Forward guidance drives price | Lowering guidance after a beat causes stock declines because markets price future earnings, not past ones. |
| Tone divergence is a signal | When sentiment shifts before financials do, volatility often follows in the next one to two quarters. |
| Q&A reveals hidden risks | Recurring analyst questions on the same topic signal unresolved risks worth tracking closely. |
| Longitudinal tracking wins | Comparing calls across four or more quarters reveals trends that single-quarter analysis misses entirely. |
| Bull and bear cases sharpen decisions | Framing both sides of the investment thesis from call data leads to better position sizing and risk management. |
What most investors get wrong about earnings calls
The most common mistake I see individual investors make is treating the earnings call as a verdict rather than a data point. They listen for the EPS beat or miss, form an opinion in the first ten minutes, and stop there. That approach misses the entire value of the exercise.
The prepared remarks are written by investor relations teams and reviewed by lawyers. They are polished and controlled. The real information lives in the Q&A, where analysts push back and management has to respond in real time. I have seen calls where the headline numbers looked excellent but three consecutive margin questions got deflected with vague language. The stock rallied that day and fell 15% over the next two months.
The other mistake is ignoring the trend. A single call is a snapshot. Four calls in a row showing decelerating revenue growth and tightening language around guidance is a pattern. Patterns are what drive long-term investment outcomes. Most investors never build the discipline to track calls systematically because it requires consistent effort with no immediate payoff.
My honest recommendation is to start with three companies you already own or follow closely. Listen to their last four calls back to back. You will hear the narrative shift in ways that the financial tables never show. That exercise alone will change how you read every quarterly earnings review going forward.
— Matt
How Oracleinvestments supports smarter earnings analysis
Individual investors who want to act on earnings call insights need a way to quickly validate whether the numbers management cited actually reflect strong fundamentals. Oracleinvestments scores over 260 stocks across profitability, valuation, and financial health, so you can cross-check management's claims against objective data in seconds.

After a call, you can pull up a company's score on Oracleinvestments and see immediately whether the fundamentals support the narrative management presented. The platform integrates investment principles from Warren Buffett, Charlie Munger, and Peter Lynch, giving individual investors a framework grounded in decades of proven practice. Real-time portfolio tracking means you can act on earnings insights without losing sight of your overall position. Sophisticated analysis does not require institutional resources when the right tools are built for individual investors.
FAQ
What is earnings call analysis?
Earnings call analysis is the systematic review of a company's quarterly conference call to extract insights about financial performance, management confidence, and future outlook. It goes beyond headline numbers to interpret tone, guidance, and the Q&A session.
How long does it take to analyze an earnings call?
A thorough financial call breakdown typically takes one to two hours per call, covering the press release, prepared remarks, and full Q&A transcript.
Why does forward guidance matter more than past earnings?
Guidance influences valuation more than reported results because stock prices reflect future earnings expectations. A guidance cut after a strong beat almost always triggers a price decline.
What is sentiment divergence in an earnings call?
Sentiment divergence occurs when management tone shifts toward caution while financial results still appear strong. Research shows this divergence often predicts future stock volatility better than the numbers alone.
How many quarters of calls should I track for a company?
Tracking four to eight consecutive quarters gives enough data to identify revenue trends, margin direction, and language patterns that single-quarter investor call analysis cannot reveal.