
Enterprise value is the theoretical price a buyer would pay to acquire an entire company, debt and all. The formula, in its simplest form: EV = Market Cap + Debt + Preferred Stock + Minority Interest − Cash. A shortcut version many analysts use is EV ≈ Market Cap + Net Debt, which gets you close enough for a quick screen.
Understanding enterprise value matters because market cap alone tells you what shareholders own, not what it would cost to buy the whole business, debt obligations included. That distinction shows up constantly in real financial work. Analysts lean on EV for three main jobs:
- M&A pricing — EV approximates what an acquirer actually has to pay, including debt assumed and cash absorbed.
- Capital-structure-neutral comparables — multiples like the EV/EBITDA multiple let you compare a heavily leveraged company against a debt-free one without distortion.
- LBO and transaction modeling — private equity firms build entire deal structures around EV because it reflects total consideration, not just equity price.
Oracle Investments treats EV as one of the fundamentals worth scoring alongside profitability and financial health, precisely because it answers a question market cap can't.
Key Takeaways
Enterprise value works because it captures the full cost of ownership, debt and cash included, which is why it beats market cap for comparing companies with different financing structures.
| Point | Details |
|---|---|
| Core formula | EV equals market cap plus debt, preferred stock, and minority interest, minus cash and equivalents. |
| Market cap answers a different question | Market cap shows shareholder value; EV shows the full takeover cost including debt assumed. |
| Multiples need EV to work | EV/EBITDA and EV/Sales stay capital-structure neutral, letting you compare leveraged and unleveraged companies fairly. |
| Watch for hidden claims | Operating leases, pensions, and hybrid securities often belong in the calculation but hide in footnotes. |
| Apply it with the right tools | Oracle Investments scores debt, cash, and valuation fundamentals together so you can spot EV-driven mispricings faster. |
This article is general information, not a substitute for advice from a qualified financial advisor. Consult a qualified financial professional about your own circumstances before acting on anything here.
Table of Contents
- What Enterprise Value Really Measures (And Why It Beats Market Cap Alone)
- The Enterprise Value Formula and Where Each Input Comes From
- A Worked Example: Calculating Enterprise Value Step by Step
- EV/EBITDA, EV/EBIT, and Other Multiples Analysts Actually Use
- When Enterprise Value Gets Misleading
- How to Actually Use Enterprise Value in Your Analysis
- What Damodaran's Framework Gets Right About Enterprise Value
- Sources
What Enterprise Value Really Measures (And Why It Beats Market Cap Alone)
Enterprise value represents the market value of every claim on a business: what shareholders own, what lenders are owed, what preferred holders and minority stakeholders are entitled to, minus the cash sitting on the balance sheet that could offset the purchase price. It's the number that maps most directly to the idea of a full takeover.
Market capitalization and enterprise value answer two different questions entirely:
- Market cap answers: "What do the shareholders currently own?" It's just shares outstanding times share price.
- Enterprise value answers: "What would it cost to buy the entire operating business, assume its debts, and pocket its cash?"
Two companies can have identical market caps and wildly different enterprise values, purely because one carries heavy debt and the other doesn't. That's not a footnote. It's the entire reason EV exists as a metric.
In practice, you reach for EV when doing comparables, modeling an acquisition, or building an LBO. You reach for market cap when calculating something shareholder-specific, like P/E ratios or total shareholder return. EV gets paired constantly with multiples such as EV/EBITDA precisely because it neutralizes differences in how companies finance themselves, letting you compare a business funded mostly by debt against one funded mostly by equity on equal footing, as Corporate Finance Institute notes in its breakdown of the formula.
The Enterprise Value Formula and Where Each Input Comes From
The full formula: EV = Market Cap + Total Debt + Preferred Stock + Minority Interest − Cash and Equivalents. The simplified version most retail investors use drops preferred stock and minority interest when a company doesn't carry them, leaving just market cap plus net debt.
Here's where each piece actually lives on a company's financial statements:
- Market cap — shares outstanding multiplied by current share price. Use fully diluted shares when a company has significant stock options or convertible securities outstanding, not basic shares, or you'll understate the equity component.
- Total debt — add short-term debt and long-term debt lines from the balance sheet. Include capital leases; check the debt footnote for anything not broken out on the face of the statement.
- Cash and equivalents — pulled straight from the balance sheet, typically the top line of current assets.
- Preferred stock — found in the equity section or debt footnotes, valued at market price when available, book value otherwise.
- Minority interest (also called noncontrolling interest) — appears on the balance sheet when a company owns less than 100% of a subsidiary it consolidates.
Pro Tip: Not all cash counts the same. "Excess cash" (money beyond what the business needs to operate) can arguably be subtracted in full, but operating cash tied up in daily working capital sometimes shouldn't be. When in doubt, subtract total cash and equivalents for a conservative estimate, then note the adjustment if you think it overstates the discount.
When market value of debt isn't quoted anywhere, book value works as a proxy, though analysts should document that substitution and test how sensitive their conclusion is to it, according to Corporate Finance Institute's guidance on the formula's inputs.
A Worked Example: Calculating Enterprise Value Step by Step
Take a hypothetical company, "Meridian Tools." Here's the full calculation:
- Market cap: 50 million shares outstanding × $40 per share = $2 billion
- Total debt: $600 million (short-term plus long-term, from the balance sheet)
- Cash and equivalents: $300 million
- Preferred stock and minority interest: $0 (none outstanding)
- Enterprise value: $2,000M + $600M − $300M = $2.3 billion
That single number lets you compare Meridian against a competitor with a completely different debt load, which a simple market cap-to-earnings comparison can't do.
For private companies, you don't have a quoted share price, so the workflow shifts:
- Use recent transaction comparables (what similar private businesses sold for) instead of a market-derived equity value.
- Apply owner's discretionary earnings adjustments to normalize for compensation and one-off expenses before running any multiple.
- Estimate an implied equity value from the transaction multiple, then work backward to an EV-equivalent figure using the same debt-and-cash logic.
Watch for timing mismatches too. A market price captured today against a balance sheet that's three months old, especially after a recent debt issuance or a big cash payout, will throw off the whole calculation.
EV/EBITDA, EV/EBIT, and Other Multiples Analysts Actually Use
EV becomes genuinely useful once you pair it with an operating metric. The most common combinations:
- EV/EBITDA — the workhorse multiple. Strips out interest, taxes, depreciation, and amortization, making it the go-to for comparing capital-intensive businesses like manufacturing or telecom.
- EV/EBIT — similar, but keeps depreciation and amortization in the mix. More useful when comparing companies with meaningfully different capital expenditure profiles.
- EV/Sales — the fallback when a company has no earnings yet, common for early-stage or high-growth names, especially in software.
- EV/FCF (free cash flow) — favored by investors who care more about actual cash generation than accounting earnings; read more on how free cash flow factors into that view.
That pairing works because EV/EBITDA is capital-structure neutral, according to Investopedia's comparison methodology, since EV already accounts for leverage and EBITDA sits above the interest line.
The trap is using these multiples across industries without adjusting for structural differences. A capital-heavy utility and an asset-light SaaS company will never look comparable on EV/EBITDA, no matter how close the raw numbers land. Normalize for one-time items and differing accounting policies before drawing conclusions, and dig deeper into EV/EBITDA mechanics if you want the full derivation.

When Enterprise Value Gets Misleading
Raw EV isn't foolproof. Several situations demand a second look before you trust the number:
- Negative EV — happens when cash exceeds combined market cap and debt. It looks like a screaming bargain but usually signals something else going on operationally.
- Cash-rich companies — heavy net cash positions can make EV understate what a buyer would actually need to pay, especially if that cash is trapped overseas or earmarked for pension obligations.
- Hybrid securities — convertible debt and warrants complicate the equity component; treat in-the-money convertibles as if converted, using the "if-converted" method.
- Operating leases and pensions — both function like debt but often sit in footnotes rather than on the balance sheet, so they get missed entirely if you only skim the main statements.
- One-time items — a big legal settlement or asset sale can distort the year's EBITDA, throwing off any multiple built on it.
- Cross-border accounting differences — leverage, lease treatment, and pension funding rules vary enough between jurisdictions to make raw cross-border comparisons unreliable without adjustment.
Pro Tip: Before finalizing any EV calculation, check the lease and pension footnotes specifically. Off-balance-sheet obligations under current lease accounting standards and unfunded pension liabilities are debt-like claims that belong in your EV math even though they never touch the balance sheet's main lines. Document every adjustment you make so someone reviewing your work later can trace your logic.
One more caveat: EV loses most of its usefulness for banks and insurers, where debt is essentially the raw material of the business rather than a financing choice. Metrics like price-to-book or price-to-tangible-book work better there.
How to Actually Use Enterprise Value in Your Analysis
A repeatable workflow keeps EV analysis from turning into guesswork:
- Gather your inputs — market cap, total debt, cash, preferred stock, and minority interest, all from the same reporting period.
- Compute EV using the formula, noting any book-value proxies you had to use for debt.
- Normalize the operating metric — strip one-off items from EBITDA, EBIT, or FCF before pairing it with EV.
- Compute the relevant multiple — EV/EBITDA for most cases, EV/Sales for pre-profit companies.
- Compare against peers — pick companies with similar capital intensity and business models, not just similar names.
- Interpret the gap — a lower multiple than peers might mean undervaluation, or it might mean the market has priced in a real risk you haven't found yet.
Red flags that should stop you and dig deeper:
- Enterprise value that's negative or close to zero relative to market cap.
- Large off-balance-sheet claims disclosed only in footnotes.
- Peers using materially different accounting treatments for leases or debt.
- A capital intensity mismatch that makes the multiple comparison meaningless from the start.
Always pull your market price and your financial statement figures from the same date. A share price from this morning against a balance sheet from six months ago, right after a debt refinancing, will hand you a distorted EV every time. And if you're modeling an actual sale, translate the multiple back into expected proceeds. EV isn't what lands in a seller's bank account. Debt gets paid off first.
What Damodaran's Framework Gets Right About Enterprise Value
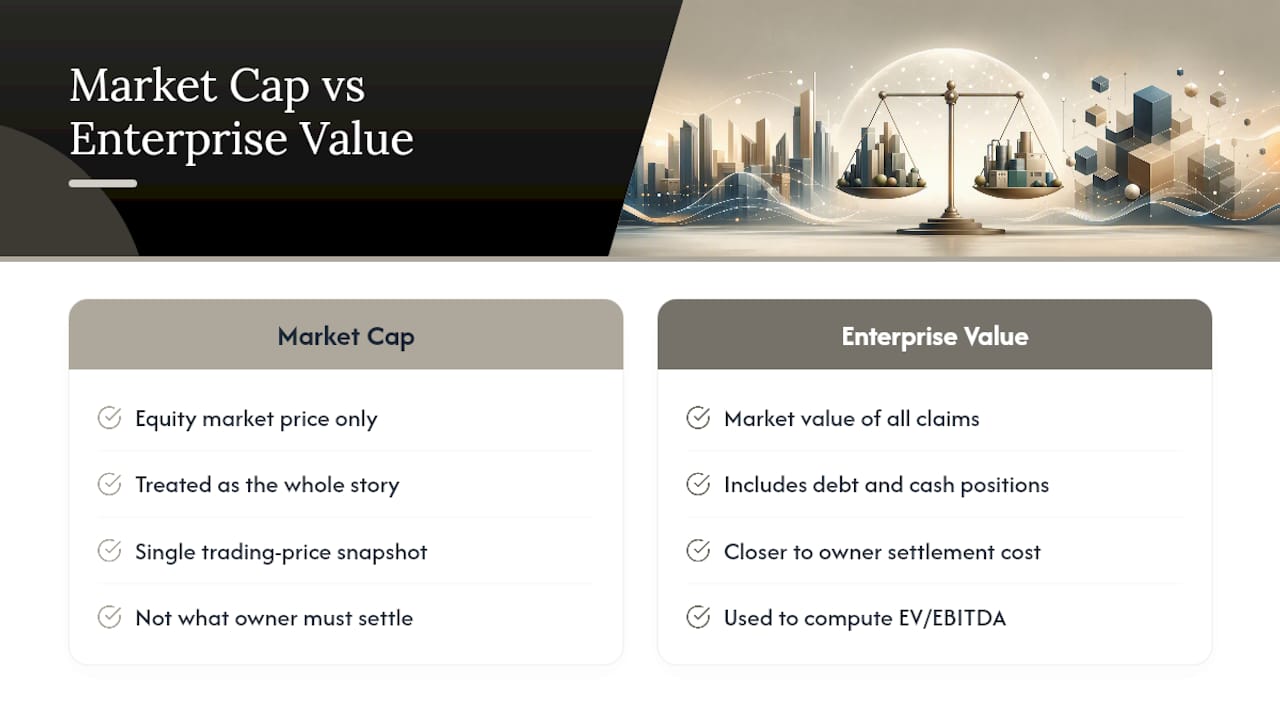
Aswath Damodaran's framing of enterprise value as the market value of all claims on a firm is the mental model worth keeping. It reframes EV away from a single trading-price snapshot and toward something closer to what a controlling owner would actually have to settle, according to the enterprise value explainer on Wikipedia that draws on his work.
That framing is exactly why Oracle Investments builds fundamentals like debt levels and cash positions into its scoring rather than treating market cap as the whole story. The worked example above is a good one to run yourself on a real company. Pull the numbers, do the arithmetic, and see how the EV/EBITDA multiple compares to what the market is implying.
Why the numbers matter more than the label
I've seen plenty of investors treat "enterprise value" as jargon to skim past, right up until they try to compare two similarly priced stocks and can't figure out why one trades at a much higher multiple. The answer is almost always sitting in the debt and cash lines. My practical rule: never trust a comparison across companies until you've reconciled EV, and if you're ever modeling an actual sale, work backward from EV to what a seller would net after debt gets cleared. That gap between EV and take-home proceeds is where a lot of deal assumptions quietly fall apart.
Screen for undervalued names without building spreadsheets from scratch
Oracle Investments turns the EV math above into a score you can see in seconds, comparing over 260 stocks on profitability, valuation, and financial health so you're not manually pulling debt and cash figures off ten different balance sheets to find the same undervalued name a hedge fund analyst spotted last week.

The app layers in investment principles from Warren Buffett, Charlie Munger, and Peter Lynch, then lets you track your portfolio and run side-by-side comparisons in real time. None of this replaces your own judgment. Treat every score as a starting point for your own research, not a final answer, and talk to a financial advisor before making any transaction decision. If you want to see how a company's real enterprise value stacks up against its market cap, start comparing stocks on Oracle and put the framework from this article to work.
Sources
- Enterprise Value (EV) Formula and What It Means - Investopedia
- Enterprise Value (EV) - Formula, Definition and Examples of EV
- Enterprise value - Wikipedia