
Joel Greenblatt's Magic Formula investing method gives individual investors a rules-based way to buy cheap, high-quality U.S. stocks without needing a finance degree. The system, laid out in The Little Book That Beats the Market, ranks stocks by two metrics, earnings yield and return on capital, then builds a 20–30 stock portfolio on a rolling monthly buy cadence with an annual rebalance. Here is what to do right now:
- Visit Magicformulainvesting and run a screen with a minimum market cap of $50 million (or higher if you prefer mid/large caps) and the standard sector exclusions.
- Buy a few positions each month until you hold around two dozen stocks.
- Set a calendar reminder to rebalance once per year, selling losers just before the 12-month mark and winners just after.
- Use Oracleinvestments to score and track your holdings against profitability, valuation, and financial health metrics as you build the portfolio.
Key Takeaways
The Magic Formula investing strategy works when investors apply both metrics consistently, hold a diversified 20–30 stock portfolio, and commit to annual rebalancing over a multi-year horizon.
| Point | Details |
|---|---|
| Two metrics, one ranking | Rank stocks by earnings yield (EBIT/EV) and return on capital (EBIT/invested capital), then add ranks; lowest composite score wins. |
| Rolling buy cadence | Buy 2–3 positions per month to build a 20–30 stock portfolio and reduce timing risk. |
| Tax-aware rebalancing | Sell losers just before the one-year mark and winners just after to optimize U.S. capital gains treatment. |
| Patience is required | Academic evidence shows mixed results in some subperiods; a 5–10+ year horizon is needed for the strategy's historical edge to materialize. |
| Oracleinvestments as a tool | Oracleinvestments scores U.S. stocks on profitability and valuation, making it a practical starting point for building and tracking a Magic Formula portfolio. |
Table of Contents
- What is Magic Formula investing and where did it come from?
- How do you calculate the two core Magic Formula metrics?
- How do you implement the Magic Formula step by step?
- Which stocks does the Magic Formula exclude by default?
- What does the evidence actually say about Magic Formula performance?
- Where does the Magic Formula fail and how do you manage those risks?
- Where can you run a Magic Formula screen?
- How to implement the Magic Formula using Oracleinvestments
- Who should actually use the Magic Formula?
- Oracleinvestments makes Magic Formula implementation faster
- Sources
What is Magic Formula investing and where did it come from?
Magic Formula investing is a systematic, rules-based value strategy that ranks stocks by two ratios — earnings yield and return on capital — to find good businesses trading at cheap prices. Joel Greenblatt, a hedge fund manager and Columbia Business School professor, introduced the method in his 2005 book The Little Book That Beats the Market. The core idea is disarmingly simple: buy above-average businesses at below-average prices, hold them for about a year, then repeat.
Greenblatt framed the approach as a simplified, disciplined version of the value investing principles used by Warren Buffett and Charlie Munger. As Wikipedia's overview of the method notes, the formula's power is as much behavioral as mathematical — it forces investors to follow a systematic process even when individual picks look uncomfortable.
The official screener at MagicFormulaInvesting.com automates the ranking process and serves as the canonical starting point for most individual investors implementing the strategy today.
How do you calculate the two core Magic Formula metrics?
Investopedia's breakdown of the strategy defines the two ratios precisely. Both use EBIT (earnings before interest and taxes) as the numerator, which strips out the distorting effects of capital structure and tax rates so you can compare companies on an apples-to-apples basis.
Earnings Yield (EY) = EBIT ÷ Enterprise Value
Enterprise Value (EV) = Market cap + Total debt + Minority interest + Preferred shares − Cash and cash equivalents. Using EV instead of market cap accounts for a company's debt load, so a heavily leveraged firm doesn't look artificially cheap.
Return on Capital (ROC) = EBIT ÷ (Net Fixed Assets + Net Working Capital)
Net fixed assets are property, plant, and equipment net of depreciation. Working capital here excludes excess cash and interest-bearing debt, keeping the focus on the operating capital the business actually needs to run.
How the composite ranking works
- Rank every stock in your universe from highest to lowest ROC. Assign rank 1 to the highest ROC.
- Rank every stock from highest to lowest EY. Assign rank 1 to the highest EY.
- Add the two ranks together to get a composite score.
- Sort by composite score, lowest to highest. The stocks at the top of that list are your candidates.
A company ranked 15th on ROC and 8th on EY gets a composite of 23. A company ranked 3rd on ROC and 50th on EY gets a composite of 53. The first company wins, even though it has a lower ROC rank, because it is much cheaper.
Worked example
Company B ranks higher on both metrics, so it sits higher on the final list. In a real screen, you would run this across hundreds of companies and take the top 20–30.
Pro Tip: Strip out nonrecurring items before computing EBIT. A one-time asset sale or restructuring charge can inflate or deflate EBIT significantly, making a mediocre business look like a Magic Formula candidate. Pull the trailing twelve-month EBIT from the income statement and adjust for any items management flags as non-operating.
For a deeper look at return on capital calculations and the variations you'll encounter across data providers, the Oracleinvestments blog covers the mechanics in detail.
How do you implement the Magic Formula step by step?
Investing stresses that execution discipline, not just the math, determines whether you see results similar to backtests. Follow these steps in order.
- Set your universe. Go to MagicFormulaInvesting.com or your chosen screener. Set a minimum market cap (more on thresholds in the next section). Exclude financial stocks and utilities. Decide whether to include ADRs.
- Run the screen. Generate the ranked list. You want the top 20–30 stocks by composite score.
- Buy 2–3 positions per month. Spreading purchases over 10–12 months reduces timing risk. Each position should represent roughly 3–5% of the portfolio at cost.
- Hold for one year. The one-year holding rule is not arbitrary — it aligns with long-term capital gains treatment in the U.S. tax code.
- Sell tax-aware. Sell losing positions a few days before the one-year anniversary to realize short-term losses (which offset short-term gains). Sell winning positions a few days after the anniversary to qualify for long-term capital gains rates.
- Rebalance annually. After selling, re-run the screen and buy the new top-ranked names that are not already in your portfolio.
- Repeat. The process restarts each year.
Practical monitoring checklist
- Daily/weekly: Watch for earnings announcements, M&A news, or delistings on any holding. Flag anything unusual for review.
- Quarterly: Verify that no position has grown to more than 8–10% of the portfolio due to price appreciation. If one has, consider trimming.
- Annually: Re-run the full screen, execute the tax-aware sells, and replace exited positions with new top-ranked names.
Pro Tip: Transaction costs and bid-ask spreads eat into returns, especially for smaller positions. If you are working with a portfolio under $50,000, consider buying 1–2 positions per month rather than 2–3, and use a zero-commission broker to keep friction costs near zero. The SoFi guide on Magic Formula implementation flags trading costs as one of the most underestimated real-world frictions.
Which stocks does the Magic Formula exclude by default?
The standard filters exist because the formula's math breaks down for certain business types. Apply all of them before ranking.
- Minimum market cap. Greenblatt originally suggested $50 million as a floor. Many practitioners today use $100 million or higher to avoid microcap liquidity problems. Larger investors often set $500 million or more to stay in names they can actually trade without moving the price.
- Exclude financial stocks (banks, insurance, REITs). These businesses use leverage as a core operating input, not just financing. Their balance sheets make EV and working capital calculations meaningless in the context of the Magic Formula.
- Exclude utilities. Utilities are heavily regulated, capital-intensive, and often carry government-mandated return structures. Their ROC figures reflect regulatory decisions, not management quality.
- ADRs and foreign listings. Greenblatt's original screen focused on U.S.-listed companies. ADRs introduce currency risk, different accounting standards (IFRS vs. GAAP), and less reliable financial data. Most practitioners exclude them or apply extra scrutiny before including any.
- Liquidity filter. For any stock near your market-cap floor, check average daily trading volume. A stock with a $100 million market cap but only $50,000 in daily volume is effectively untradeable at scale without significant market impact.
These exclusions are built into the official screener by default, which is one reason MagicFormulaInvesting.com remains the most convenient starting point for individual investors.

What does the evidence actually say about Magic Formula performance?
Greenblatt's own backtests showed strong outperformance over multi-decade periods, and several independent researchers have broadly confirmed the direction of that finding — though the magnitude varies considerably depending on the time period, universe, and methodology used.
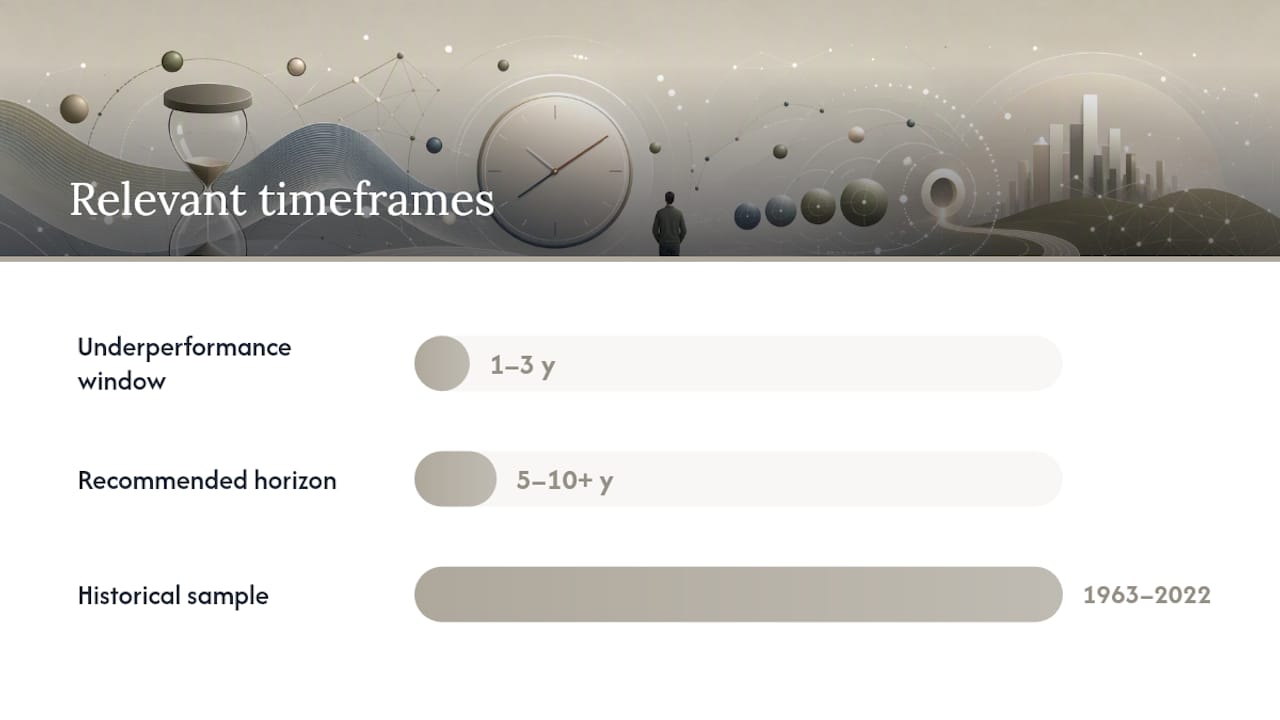
Academic research from Erasmus University Rotterdam found that the Magic Formula produced significant raw and risk-adjusted returns in earlier sample periods, but the evidence is mixed or weaker in some more recent subperiods. Adding momentum factors or substituting alternative profit measures did not consistently improve results. A separate analysis cited by Wikipedia's entry on the strategy found that a 2024 evaluation covering 1963–2022 showed the formula produces meaningful returns in many samples, but no single version of the formula outperforms across every metric after factor adjustments.
The honest interpretation: much of the formula's historical outperformance overlaps with well-documented factor premiums — value, size, and profitability. When those factors underperform (as value did for much of the 2010s), the Magic Formula tends to underperform too.
What this means practically: Expect multi-year stretches where the portfolio lags the S&P 500. Greenblatt himself documented periods of 1–3 years of underperformance in his original backtests. Investors who abandoned the strategy during those windows locked in losses rather than capturing the eventual recovery.
Key takeaways from the evidence:
- A 5–10+ year horizon is the minimum for the strategy to have a reasonable chance of delivering its historical edge.
- Diversification across 20–30 names reduces single-stock risk without diluting the factor exposure.
- Factor overlap with value and profitability means the strategy is not a free lunch — it is a disciplined bet on those factors recovering over time.
- Past performance in backtests does not guarantee future results, and real-world frictions (taxes, spreads, data errors) reduce net returns below backtest figures.
For context on how to measure and interpret portfolio-level risk-adjusted returns, the Sharpe ratio explained guide on the Oracleinvestments blog is a useful companion.
Where does the Magic Formula fail and how do you manage those risks?
The formula is mechanical by design, which is its strength and its weakness. It cannot read a footnote, assess management quality, or flag a business model that is structurally deteriorating. These are the failure modes to watch.
- Value traps. A stock can score well on EY and ROC because its price has collapsed, not because it is genuinely cheap relative to future earnings. Declining businesses with high historical EBIT but shrinking revenue are a recurring trap.
- Stale or distorted EBIT. Acquisitions, restructurings, and one-time items can make trailing EBIT look much better or worse than the run-rate reality. Always check whether the EBIT figure is representative of ongoing operations.
- Hidden leverage. The formula uses EV, which includes debt, but it does not penalize companies for dangerously high leverage ratios. A company with a 10x debt-to-EBITDA ratio can still rank well if its EBIT is high enough.
- Small-cap liquidity. Near the market-cap floor, bid-ask spreads can be wide enough to meaningfully erode returns on entry and exit. This is especially true for positions held less than a year.
- Corporate actions. Spin-offs, mergers, and delistings disrupt the one-year holding plan. When a holding announces a merger, decide in advance whether to hold through close or exit early. Spin-offs should be evaluated as new positions against the current screen.
Mitigation tactics
- Add a minimum EBIT profitability test: exclude any company with negative trailing twelve-month EBIT before ranking.
- Cap individual positions at 5% of portfolio at cost to limit single-stock damage.
- Use a trailing filter: if a stock's EBIT turns negative after purchase, flag it for early review rather than waiting for the annual rebalance.
- Maintain a simple exceptions log — a spreadsheet noting any holding affected by M&A, spin-offs, or accounting restatements, with a decision and date recorded.
Pro Tip: Before buying any Magic Formula candidate, spend five minutes on the most recent 10-K. Check whether EBIT includes a large gain on asset sales or a one-time settlement. If it does, recalculate EBIT without that item. A stock that drops out of the top 30 after that adjustment probably should not be in the portfolio.
Common value investing mistakes beginners make — including anchoring to a single metric and ignoring balance sheet risk — apply directly to Magic Formula implementation.
Where can you run a Magic Formula screen?
Three practical options exist, each with different tradeoffs between convenience, control, and data transparency.
| Method | Ease | Control | Data Transparency |
|---|---|---|---|
| MagicFormulaInvesting.com | High | Low | Low (black box) |
| Manual spreadsheet | Low | High | High |
| Broker/third-party screener | Medium | Medium | Medium |
Official screener (MagicFormulaInvesting.com): The simplest option. Set your market-cap minimum, and the site returns a ranked list. The downside is that you cannot see the underlying EBIT or EV figures, so you cannot verify the math or adjust for data anomalies.
Manual spreadsheet: Pull EBIT, total debt, cash, market cap, net PP&E, and working capital from a data provider like Macrotrends or a brokerage's fundamental data feed. Build the EY and ROC formulas in Excel or Google Sheets, rank each column, sum the ranks, and sort. This takes more time but gives you full visibility into every number.
Broker and third-party screeners: Tools that offer fundamental screening can approximate the Magic Formula if they expose EBIT/EV and EBIT/invested capital as filterable fields. Verify that the platform computes EBIT correctly (operating income before interest and taxes, not net income) and that EV includes debt and subtracts cash. For portfolio analysis tools that go beyond screening into ongoing performance tracking, the Oracleinvestments blog has a current comparison.
Fields you need to pull for a manual screen:
- EBIT (trailing twelve months, adjusted for nonrecurring items)
- Market capitalization
- Total debt (short-term + long-term)
- Cash and cash equivalents
- Net property, plant, and equipment
- Net working capital (current assets minus current liabilities, excluding excess cash and short-term debt)
How to implement the Magic Formula using Oracleinvestments
Oracleinvestments scores over 260 U.S. stocks across profitability, valuation, and financial health, which maps directly onto the two dimensions the Magic Formula measures. Here is how to use it for a practical implementation:
- Open the app and filter by valuation score. Oracleinvestments surfaces stocks with strong earnings yield signals through its valuation scoring, giving you a pre-filtered starting list.
- Cross-check profitability scores. The app's profitability dimension captures return-on-capital quality. Stocks that score well on both valuation and profitability are your Magic Formula candidates.
- Compare candidates side by side. Use the instant comparison feature to review two or three top-ranked names against each other before committing capital.
- Schedule your monthly buys. Use the portfolio tracking feature to log each purchase date, which you will need for the tax-aware sell timing at the 12-month mark.
- Set a rebalance reminder. Oracleinvestments' portfolio tracking lets you monitor positions in real time, so you can catch corporate actions or deteriorating fundamentals between annual rebalances.
Key features that address common Magic Formula pain points:
- Built-in fundamental scoring reduces the risk of relying on stale or unadjusted EBIT figures.
- Side-by-side comparisons make it faster to spot outliers before they enter the portfolio.
- Real-time portfolio tracking flags portfolio drift when a position grows disproportionately large between rebalances.
Pro Tip: Always validate the underlying financial figures in Oracleinvestments against the company's most recent SEC filing before executing a trade. No data provider is immune to reporting lags or calculation differences, and a five-minute check on the 10-Q can save a costly mistake.
Disclosure: this article is published by Oracleinvestments. The implementation walkthrough above reflects the app's current feature set; it is not a guarantee of investment results.
Who should actually use the Magic Formula?
The Magic Formula is genuinely useful for a specific type of investor: patient, disciplined, and comfortable holding a diversified basket of stocks that may look ugly for a year or two before the thesis plays out. If that description fits you, the strategy offers a systematic framework that removes most of the emotional decision-making from stock selection.
It is a poor fit for short-term traders, investors who need regular income from their portfolio, or anyone who will abandon the process after six months of underperformance. The academic evidence is clear that the strategy's edge, to the extent it exists, requires a long holding horizon and consistent execution. Checking the portfolio daily and second-guessing every position is the fastest way to undermine it.
For investors with smaller portfolios or concentrated holdings, a sensible adaptation is to raise the market-cap floor to $500 million or higher. This narrows the universe but improves liquidity and data quality, which matters more than maximizing the number of candidates when you are working with limited capital.
Oracleinvestments makes Magic Formula implementation faster
Running a Magic Formula screen manually takes time, and the biggest risk is not the math — it is using bad data. Oracleinvestments scores over 260 U.S. stocks on the exact fundamentals the Magic Formula depends on: profitability, valuation, and financial health. Instead of building a spreadsheet from scratch, you get a pre-scored list you can filter, compare, and act on in minutes.

The app's side-by-side comparison feature lets you stack your top candidates against each other before buying, and real-time portfolio tracking keeps you informed between annual rebalances without requiring daily manual checks. For investors who want the discipline of a systematic value strategy without the operational overhead, Oracleinvestments removes the friction between the screen and the trade.
Download Oracleinvestments from the Apple App Store and import your first Magic Formula watchlist today.
This article is published by Oracleinvestments. It is general information, not investment advice. Verify all financial figures against primary sources before trading.
Sources
The sources below cover the official screener, Greenblatt's original book, and the key academic and practical explainers referenced throughout this article.
- Magic Formula Investing Explained: Simple Strategy for Value Investing
- Magic formula investing
- Unravelling the magic of Magic Formula investing
- How Does Magic Formula Investing Work? | SoFi
This article is general information, not a substitute for advice from a qualified financial advisor. Consult a qualified financial professional about your own circumstances before acting on anything here.