
For a serious intrinsic value calculation, use a Discounted Cash Flow (DCF) model. For quick checks, use the Dividend Discount Model (DDM) for dividend-paying stocks or the EPS × P/E approximation for a rough sanity check. All three methods are recognized by Investopedia, the CFA Institute, and valuation theorist Aswath Damodaran as the core toolkit for fundamental value analysis.
The core formulas at a glance:
- DCF: Intrinsic Value = Σ (FCFₜ / (1+r)ᵗ) + Terminal Value / (1+r)ⁿ
- DDM: Intrinsic Value = D₁ / (Cost of Equity − Dividend Growth Rate)
- EPS × P/E: Intrinsic Value ≈ Trailing EPS × Justified P/E Multiple
One critical warning before you build anything: a shift in your discount rate or terminal growth rate can significantly change your output. Run scenarios, not single estimates.
Key Takeaways
DCF is the most rigorous method for intrinsic value calculation, but its output is only as reliable as the assumptions behind it, which is why sensitivity analysis and a margin of safety are non-negotiable.
| Point | Details |
|---|---|
| DCF is the standard method | Discount forecasted free cash flows at WACC or cost of equity, then add terminal value for a full intrinsic estimate. |
| Use DDM and EPS × P/E for quick checks | DDM fits stable dividend payers; EPS × P/E works for fast screening but is not a substitute for a full DCF. |
| Terminal value dominates DCF results | Cap perpetual growth at 2–3% for most companies; a rate above long-term US nominal GDP expectations is hard to defend. |
| Always run a sensitivity matrix | Test discount rate vs. terminal growth across a range of inputs to produce a valuation range, not a single number. |
| Adjust for capital structure | Subtract net debt and add non-operating assets before dividing enterprise value by diluted shares outstanding. |
| Oracleinvestments automates the workflow | The app scores 260+ stocks with editable assumptions, scenario-saving, and real-time portfolio tracking. |
Table of Contents
- What are the main methods for calculating intrinsic value?
- How do you build a DCF step by step?
- How do you choose a discount rate and growth assumptions?
- How do you test your model and avoid common valuation mistakes?
- What tools and calculators should you use?
- A worked DCF example you can reproduce in a spreadsheet
- A practical DCF template and checklist
- Why intrinsic value is a range, not a verdict
- Oracleinvestments makes intrinsic-value analysis faster without hiding the math
- Sources
What are the main methods for calculating intrinsic value?
Three methods dominate practical intrinsic valuation. Each fits a different situation.
Discounted cash flow (DCF)
DCF is the most rigorous approach. It values a business by forecasting its future free cash flows and discounting them back to today using a rate that reflects risk. You can value the whole firm using Free Cash Flow to Firm (FCFF) discounted at WACC, or value just the equity using Free Cash Flow to Equity (FCFE) discounted at the cost of equity. The result is an estimate of what the business is worth based purely on its economics, not what the market says today.
Best for: Companies with predictable cash flows, long operating histories, and accessible financial filings. Weakness: Highly sensitive to assumptions. Small errors compound over a 10-year forecast.
Dividend discount model (DDM)
DDM simplifies the DCF by treating dividends as the relevant cash flow. The Gordon Growth Model version is: Value = D₁ / (r − g), where D₁ is next year's expected dividend, r is the required return, and g is the perpetual dividend growth rate. It's clean and fast, but only works for companies with stable, predictable dividends.
Best for: Mature dividend payers like utilities or consumer staples. Weakness: Useless for non-dividend stocks; collapses when r and g are close.
EPS × P/E approximation
Multiply trailing twelve-month earnings per share by a justified P/E multiple to get a rough intrinsic estimate. The justified P/E can come from historical averages, sector norms, or a DDM-derived formula. This is a quick approximation method, not a substitute for a full DCF, but it's useful for screening dozens of stocks quickly.
Best for: Fast screening, sanity checks, comparing similar companies. Weakness: Circular if the P/E you use is itself market-derived; ignores capital structure.
How do you build a DCF step by step?
A DCF has six distinct steps. Follow them in order and you'll have a defensible model.
Step 1: Choose your valuation basis
Decide whether you're valuing the firm (FCFF) or the equity (FCFE). FCFF represents cash available to all capital providers before debt payments; FCFE is what remains after debt service. If you use FCFF, discount at WACC and subtract net debt at the end to get equity value. If you use FCFE, discount at the cost of equity directly. Mixing these up is one of the most common errors in amateur models. A deeper breakdown of free cash flow definitions can help you choose the right basis before you start.
Step 2: Gather your inputs
Pull these directly from SEC filings (10-K and 10-Q), management guidance, and consensus analyst forecasts:
- Forecast period: Typically several years
- Revenue and growth drivers: Historical revenue CAGR, addressable market, management guidance
- Operating margins: EBIT or EBITDA margins from recent filings
- Reinvestment: Capital expenditures and changes in working capital
- Tax rate: Effective tax rate from the income statement
- Debt and cash: Total debt and cash/equivalents from the balance sheet
- Shares outstanding: Diluted share count from the most recent 10-K
For the risk-free rate, use the current 10-year US Treasury yield. For the equity risk premium, Damodaran publishes updated estimates on his NYU website.
Step 3: Forecast free cash flows
Project revenue year by year, apply your margin assumptions, subtract taxes, capex, and working capital changes. The result is FCFF (or FCFE if you've already netted out interest and debt repayment). Stage your growth: use a higher rate for the first 5 years, then step it down toward a stable rate for years 6–10.
Step 4: Calculate terminal value
Terminal value captures everything beyond your forecast period. The perpetual-growth formula is:
TV = FCFₙ₊₁ / (r − g)
where g is the perpetual growth rate. Damodaran's DCF chapter is explicit: terminal value often accounts for the majority of total DCF value, which is exactly why the growth rate you plug in here matters so much.
The exit-multiple method (applying an EV/EBITDA multiple to year-10 EBITDA) is an alternative, but it introduces a market-relative assumption into what should be an intrinsic calculation. Use it as a cross-check, not a primary method.
Step 5: Discount everything to present value
Sum the present values of each year's cash flow plus the discounted terminal value:
Intrinsic Value (Firm) = Σ [FCFₜ / (1+WACC)ᵗ] + TV / (1+WACC)ⁿ
Step 6: Convert to per-share equity value
For a FCFF model: subtract total debt, add cash and non-operating assets, then divide by diluted shares outstanding. Valuation guides recommend pulling non-operating items directly from SEC filings to avoid missing minority interests, pension liabilities, or off-balance-sheet obligations.
Pro Tip: When sourcing management guidance for growth assumptions, review earnings call transcripts alongside the 10-K. Management commentary often contains forward-looking capex and margin targets that don't appear in the filing itself.
How do you choose a discount rate and growth assumptions?
The discount rate is where most retail investors either get lazy or get overconfident. Here's a practical framework.
For cost of equity (FCFE models): Use the Capital Asset Pricing Model: Cost of Equity = Risk-Free Rate + Beta × Equity Risk Premium. The 10-year Treasury yield is the standard risk-free rate in the US. For the equity risk premium, Damodaran's annual estimates are the most widely cited reference.
For WACC (FCFF models): WACC blends the cost of equity and after-tax cost of debt, weighted by capital structure. Pull the cost of debt from the company's interest expense divided by average debt.
Practical defaults for individual investors:
- Discount rate: a moderate conservative floor is commonly used for large US equities; higher rates are appropriate for smaller or riskier companies
- Near-term growth: anchor to historical revenue growth and analyst consensus; avoid extrapolating peak margins
- Stable-period growth: step down toward a moderate single-digit percentage
- Perpetual growth (terminal): cap at 2–3% for most companies; this is roughly in line with long-term US nominal GDP expectations
The Corporate Finance Institute's intrinsic value guide describes two approaches to risk adjustment: the risk-adjusted discount rate (WACC or cost of equity) and a certainty-factor method, where you apply a probability multiplier to cash flows and discount at the risk-free rate. Both can produce comparable results; the certainty-factor approach is sometimes easier for beginners to reason about intuitively.
Pro Tip: When uncertain, raise the discount rate rather than lower the growth rate. A higher discount rate punishes distant cash flows more aggressively, which is exactly the right behavior when your long-term assumptions are speculative.
How do you test your model and avoid common valuation mistakes?
DCF models are fragile in a specific way: the assumptions that are hardest to verify (terminal growth, long-term margins) have the biggest impact on the output. Interactive Brokers' lesson on intrinsic value makes this point clearly — small changes in discount rate or growth assumptions materially shift the final number.
Building a sensitivity matrix
Set up a simple two-variable table in Excel or Google Sheets. Each cell shows the resulting per-share intrinsic value. The spread across that table represents a reasonable valuation range. If the entire table sits above the current market price, that suggests a margin of safety across scenarios. If only the most optimistic corner clears the market price, the stock may be priced assuming very optimistic conditions.
(Illustrative values only — replace with your own model outputs.)
Common pitfalls to watch for
- Overreliance on terminal value: If terminal value exceeds 80% of your total DCF output, your near-term forecast is doing almost no work. Extend the explicit forecast period or stress-test the terminal assumptions harder.
- Mismatched cash flows and discount rates: FCFF must be discounted at WACC. FCFE must be discounted at cost of equity. Mixing these produces a number that is mathematically wrong.
- Ignoring non-operating assets and liabilities: Pension obligations, operating leases, and minority interests all affect the bridge from enterprise value to equity value. Missing them overstates per-share intrinsic value.
- Failure to adjust for capital structure: A company with $10 billion in debt and $1 billion in cash has a very different equity value than its enterprise value suggests. Always reconcile.
- Anchoring to a single estimate: Damodaran frames intrinsic valuation as an exercise with many inputs and genuine uncertainty. A single-point output implies false precision.
Pro Tip: Run three scenarios explicitly: a conservative base case (higher discount rate, lower growth), a central case, and an optimistic case. Present all three. The range tells you more than any single number.
What tools and calculators should you use?
Spreadsheets first
Excel and Google Sheets remain the best environment for learning DCF. Every assumption is visible, every formula is auditable, and you can build the sensitivity matrix directly. The transparency forces you to confront what you actually believe about a company's future. Anyone who skips straight to a black-box calculator misses the most valuable part of the exercise.
What to look for in online calculators and apps
Not all tools are equal. Before trusting any calculator's output, check for:
- Editable inputs: You must be able to change the discount rate, growth rates, and forecast period yourself
- FCFF/FCFE distinction: A tool that doesn't let you choose is making the choice for you, silently
- Terminal value method: Confirm whether it uses perpetual growth, an exit multiple, or both
- Share-count adjustment: The tool should subtract debt and add cash before dividing by diluted shares
- Scenario export: The ability to save and compare multiple scenarios is what separates a learning tool from a toy
Red flags in tools
- Fixed discount rates with no WACC option
- No terminal-growth cap or a default above 4%
- No visibility into the underlying formula
- Outputs with no sensitivity range
Oracleinvestments scores over 260 stocks on profitability, valuation, and financial health, with editable assumptions and scenario-saving so you can audit every input. For investors who want to move from raw DCF math to portfolio-level tracking without losing transparency. It's a practical next step.
A worked DCF example you can reproduce in a spreadsheet
Base assumptions:
- Starting free cash flow (Year 1): $100M
- Growth rate, Years 1–5: 10% per year
- Growth rate, Years 6–10: 5% per year
- Discount rate (WACC): 10%
- Terminal growth rate: 2.5%
- Net debt (debt minus cash): $200M
- Diluted shares outstanding: 50M
Step-by-step calculation:
- Forecast FCF for each year using the growth rates above.
- Discount each year's FCF back to present value: PV = FCF / (1.10)ᵗ.
- At Year 10, calculate terminal value: TV = FCF₁₁ / (0.10 − 0.025) = FCF₁₁ / 0.075.
- Discount the terminal value: PV of TV = TV / (1.10)¹⁰.
- Sum all present values to get enterprise value.
- Subtract net debt to get equity value.
- Divide by diluted shares to get per-share intrinsic value.
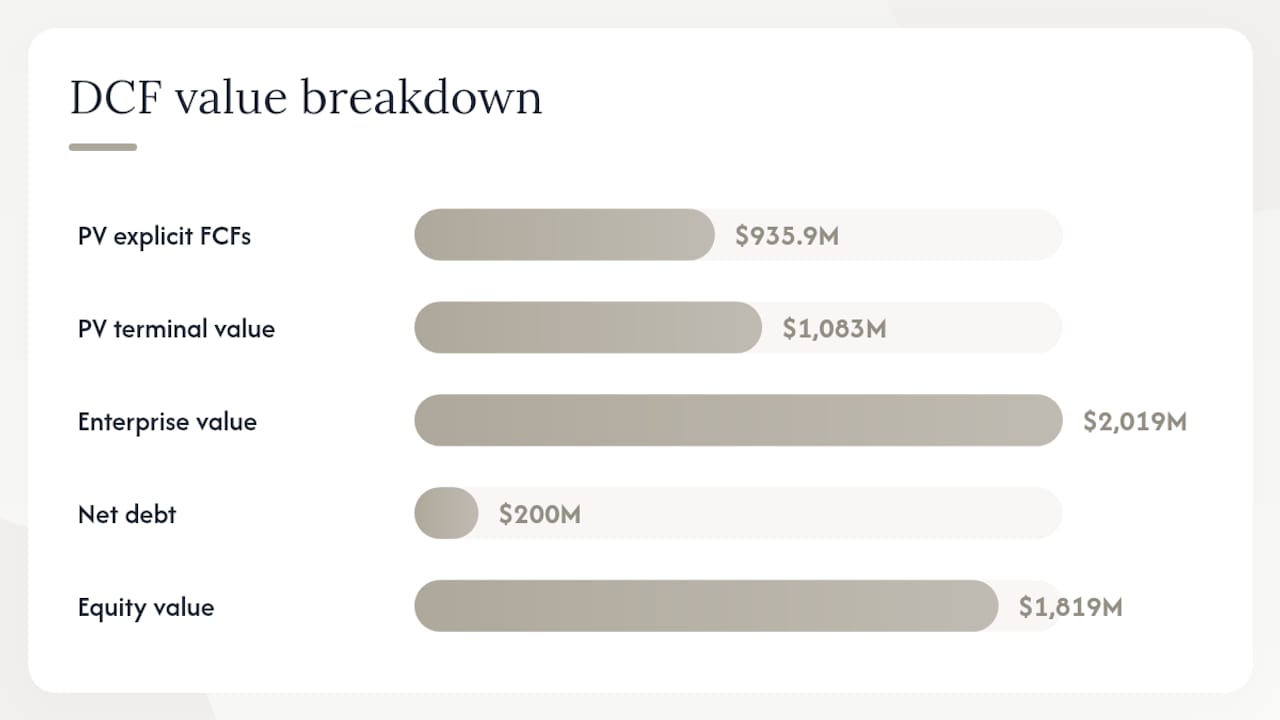
Terminal value calculation: FCF₁₁ = $205.6M × 1.025 = $210.7M TV = $210.7M / 0.075 = $2,809M PV of TV = $2,809M / (1.10)¹⁰ = $1,083M
Enterprise value: $935.9M + $1,083M = $2,019M Equity value: $2,019M − $200M (net debt) = $1,819M Per-share intrinsic value: $1,819M / 50M shares = $36.38
If the stock trades below the estimated intrinsic value by a moderate percentage, that discount might indicate a margin of safety worth considering. This is the kind of gap that signals a stock worth investigating further, not an automatic buy.
A practical DCF template and checklist
Spreadsheet structure
Build your model in four tabs:
- Inputs: Risk-free rate, ERP, beta, cost of debt, tax rate, shares outstanding, net debt, forecast period
- Forecast: Year-by-year revenue, margins, capex, working capital, and resulting FCF
- Valuation: PV of each year's FCF, terminal value, enterprise value, equity value, per-share output
- Scenarios: Three versions of the Inputs tab (bear, base, bull) feeding into a summary table
Conservative defaults for retail investors
- Discount rate: 10% minimum for large-cap US equities; 12–14% for smaller or higher-risk names
- Near-term growth: no higher than the company's 5-year historical revenue CAGR unless there's a clear structural reason
- Terminal growth: 2–2.5% for most companies; match to long-term US inflation expectations
- Margins: revert toward sector medians over the forecast period, not to peak margins
Model integrity checklist
- Forecast period and terminal value period are not overlapping
- All figures use consistent units (millions or billions throughout, never mixed)
- Operating margins in the forecast are within the historical range or have a documented reason for deviation
- Net debt figure is from the most recent balance sheet, not an older filing
- Diluted share count includes options and convertibles
- Terminal growth rate is below the discount rate (otherwise the formula breaks mathematically)
- Enterprise-to-equity bridge accounts for minority interests, pension liabilities, and operating leases
Pro Tip: Save each scenario as a named version with a date. Revisiting your assumptions after an earnings release is one of the most instructive exercises in investing — you'll see exactly where your model was wrong and why.
Why intrinsic value is a range, not a verdict
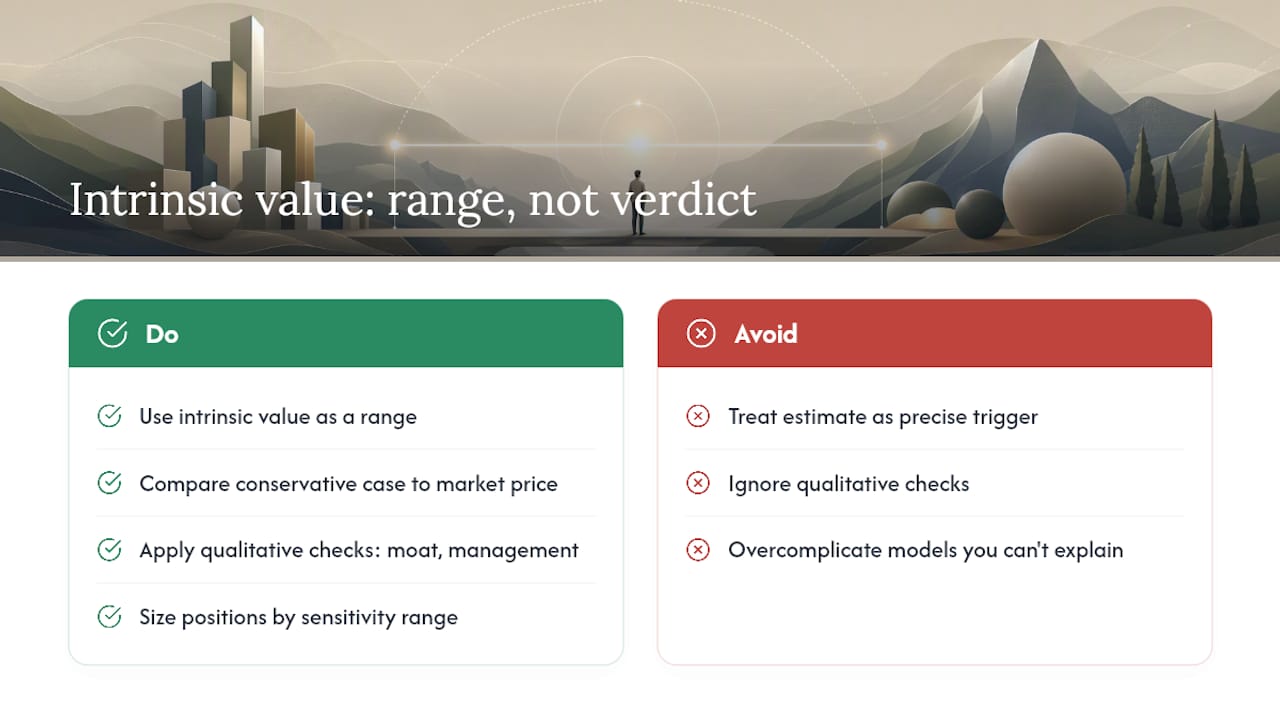
Treating an intrinsic value estimate as a precise buy/sell trigger is the most common mistake individual investors make with DCF models. Damodaran's framing is worth keeping in mind: intrinsic valuation is an attempt to estimate what a fully informed analyst would conclude, and it remains inherently uncertain. The model is a structured way to organize your beliefs about a business, not a calculator that produces ground truth.
Use intrinsic value as a screen and a range. When your conservative case sits above the market price by a meaningful margin, that's a signal worth investigating further. Pair it with qualitative checks: does the business have a durable competitive advantage? Is management allocating capital well? Are the margins you're projecting consistent with the competitive dynamics of the industry?
Intrinsic value and market value are conceptually distinct: intrinsic value is your estimate based on fundamentals; market value is what buyers and sellers have agreed to pay today. The gap between them is where investors find opportunity, but that gap can persist or widen before it closes.
Position sizing matters too. When intrinsic value exceeds market price across your sensitivity range, consider a full position. When only the optimistic scenario clears the market price, a smaller starter position makes more sense. Portfolio drift from positions that have appreciated toward or above intrinsic value is a natural trigger to rebalance.
Keep your models simple enough to rebuild from scratch. A model you can't explain in five minutes is a model you don't fully understand, and a model you don't fully understand will mislead you when the assumptions change.
Oracleinvestments makes intrinsic-value analysis faster without hiding the math
Running a full DCF from scratch takes hours. Oracleinvestments cuts that time down sharply by scoring over 260 US stocks on profitability, valuation, and financial health, with editable assumptions so you can see and change every input the model uses.

The app's scenario-saving feature lets you store a bear, base, and bull case side by side, which is exactly the workflow this guide recommends. Portfolio tracking updates in real time, so you can monitor how a stock's market price moves relative to your intrinsic estimate without rebuilding the model every quarter. Oracleinvestments also integrates investment principles from Warren Buffett, Charlie Munger, and Peter Lynch, giving context to the numbers rather than just producing them. Transparency is built in: every score and estimate shows its inputs, so you can audit the model the same way you would a spreadsheet you built yourself.
Start your analysis on Oracleinvestments and see how your watchlist stocks score against their intrinsic estimates today.
Sources
These are the canonical references behind the methodology in this guide:
- Intrinsic Value - Investopedia
- VALUATION: PRINCIPLES AND PRACTICE — Discounted Cash Flow Valuation (Damodaran, ch12)
- Intrinsic value guide | Corporate Finance Institute
- What is the Intrinsic Value of a Stock? | Interactive Brokers Campus