
The dividend payout ratio shows what slice of a company's earnings gets handed back to shareholders as dividends, and the rest tells you what management is doing with the remainder. A low ratio usually means growth and reinvestment; a high one means income, and sometimes trouble. Anything consistently over 100% deserves a hard look. The math and the warning signs are below.
TL;DR:
- Companies with payout ratios over 100% are likely drawing on cash reserves or taking on debt, which signals potential sustainability issues.
- Sector norms vary significantly, with utilities and REITs typically sustaining higher ratios, while technology firms often pay minimal or no dividends.
- The payout ratio is unreliable when based on a single year’s net income, especially if earnings are volatile or distorted by one-time gains or losses.
- Comparing the standard payout ratio with the free cash flow payout ratio helps identify if dividends are funded by actual cash flow or accounting profits.
- Using a multi-year trend and assessing the company's balance sheet provides a more accurate picture of dividend sustainability than a single ratio snapshot.
Table of Contents
- What Does the Dividend Payout Ratio Actually Measure?
- How To Calculate Your Own Payout Ratio, Step by Step
- Three Payout Ratios, Three Very Different Stories
- What Counts as a "Good" Payout Ratio?
- Dividend Yield, Buybacks, and the Augmented Payout Ratio
- Where the Payout Ratio Can Fool You
- A Practical Checklist Before You Trust a Payout Ratio
- How Oracle Investments Helps You Run This Analysis Faster
- How Payout Ratios Have Shifted Over the Decades
- Why Company Lifecycle Stage Changes What's Normal
- How the Economy Pushes Payout Ratios Up or Down
- Payout Ratio vs. Free Cash Flow Payout Ratio
- What I've Learned Trusting (and Distrusting) This Number
- Primary Sources and Further Reading
- Sources
What Does the Dividend Payout Ratio Actually Measure?
The dividend payout ratio (DPR) measures the portion of net income a company distributes to shareholders as dividends rather than keeping as retained earnings. You can calculate it two equivalent ways, and both show up constantly in stock research, so it pays to recognize each one.
- Company-level formula: DPR = Total Dividends Paid ÷ Net Income
- Per-share formula: DPR = Dividends Per Share (DPS) ÷ Earnings Per Share (EPS)
- Retention shortcut: DPR = 1 − Retention Ratio (the share of earnings kept, not paid out)
These formulas produce the same number when applied consistently, according to Wikipedia's breakdown of the dividend payout ratio. One wrinkle worth knowing: if a company has preferred stock outstanding, Corporate Finance Institute recommends subtracting preferred dividends from the numerator first, since those payments aren't available to common shareholders. The formula becomes (Dividends − Preferred Dividends) ÷ Net Income.
One more caveat before you start plugging in numbers: net income is an accounting figure, not a cash figure. A company can report solid earnings on paper while its actual cash position looks shakier, which is why serious payout ratio analysis never stops at this one number alone.
How To Calculate Your Own Payout Ratio, Step by Step
You need exactly two numbers, and both are sitting in every company's quarterly and annual filings.
- Pull the dividend figure. Find either total dividends paid (on the cash flow statement, under financing activities) or dividends per share (usually stated directly in earnings releases).
- Pull the earnings figure. Grab net income from the income statement, or EPS if you're doing the per-share version.
- Decide your time frame. Use trailing twelve months (TTM) for the most current picture, or the last full fiscal year if you want a cleaner, less noisy comparison across companies with different quarterly patterns.
- Divide dividends by earnings. DPR = DPS ÷ EPS, or Total Dividends ÷ Net Income. Round to one decimal place; anything more precise is false confidence.
Here's a worked example using realistic numbers. Say a mid-cap consumer company reports EPS of $3.70 for the trailing twelve months and has paid out $0.60 per share in dividends over that same stretch.
DPR = $0.60 ÷ $3.70 = 0.162, or 16.2%
Payout ratio: 16.2%. That means the company keeps roughly 84 cents of every dollar it earns to reinvest in the business, buy back stock, or pay down debt.
Wall Street Prep's modeling guide uses this same calculation as the backbone for forecasting future dividend capacity, since a stable payout ratio lets you project next year's dividend once you have an earnings estimate. That's a genuinely useful trick if you're building your own spreadsheet model rather than just reading someone else's numbers.
Three Payout Ratios, Three Very Different Stories
A payout ratio only means something in context. The same number can signal strength in one company and danger in another, so here's how the range typically breaks down in practice.
- Low payout: A software or biotech company reinvesting almost everything into growth. The low number isn't a red flag here. It's the whole point.
- Mid-range payout: A mature industrial or consumer-staples company balancing shareholder income with continued reinvestment. This is the zone most dividend growth investors target.
- High or over-100% payout: A company paying out more in dividends than it earned in net income that year.
Red flag threshold: above 100%. When a payout ratio crosses that line, the company is drawing on cash reserves, taking on debt, or riding a one-time gain to fund the dividend, and Investopedia flags this as a sustainability warning unless there's a clear, temporary explanation like a lawsuit settlement charge or asset write-down that dented earnings but not cash flow.
What Counts as a "Good" Payout Ratio?
There's no single correct number, but the widely cited range puts a payout ratio in a moderate band often considered stable for most established companies. Some analysts distinguish lower payout ratios as conservative and growth-oriented, and moderate ones as healthy for income-generating businesses, according to Investopedia's benchmark guidance.
Sector context changes everything, though.
- Utilities and REITs often run notably higher payout ratios, and that's normal, not alarming, because their earnings are stable and regulated, and REITs are legally required to distribute most of their taxable income.
- Technology and biotech companies often sit in the single digits or pay no dividend at all, since every dollar retained can compound faster inside the business than it would in a shareholder's pocket.
- Financial services and consumer staples tend to cluster in that 30% to 50% middle zone, reflecting steady but not explosive growth.
CFI notes that acceptable payout ratios are fundamentally industry-dependent, which is why comparing a bank's payout ratio to a semiconductor company's tells you almost nothing useful.
Pro Tip: Don't judge a payout ratio in isolation. Check the balance sheet first. A company with low debt and a cash pile can sustain a higher payout ratio through a rough year than a heavily leveraged one with the exact same number.
Dividend Yield, Buybacks, and the Augmented Payout Ratio
Payout ratio and dividend yield answer two different questions, and mixing them up is one of the most common mistakes new investors make. Dividend yield tells you your current income return relative to what you paid for the stock. Payout ratio tells you how sustainable that dividend is. They connect through a simple relationship: dividend yield roughly equals DPR multiplied by EPS, divided by share price.
Buybacks complicate the picture further. When a company favors repurchasing shares over raising dividends, a plain payout ratio understates how much cash is actually flowing back to shareholders. That's where the augmented payout ratio comes in:
- Augmented payout ratio = (Dividends + Buybacks) ÷ Net Income
- This gives a fuller view of total shareholder returns, which Wikipedia describes as increasingly relevant given how common buybacks have become in modern capital allocation.
- Income investors living off dividend checks care most about the plain payout ratio and the yield. Total-return investors care more about the augmented figure. Understanding how buybacks compare to dividends helps you tell which strategy a management team is actually running.
Where the Payout Ratio Can Fool You
A single year's payout ratio can lie to you, and it usually lies in one of a handful of predictable ways. Earnings volatility is the biggest culprit: a one-time write-down, a lawsuit settlement, or an asset sale can swing net income wildly without touching the company's actual ability to pay dividends.
- Compare the payout ratio against a free cash flow payout ratio (dividends ÷ free cash flow) since cash, not accounting earnings, is what actually funds a dividend check.
- Look at the trend over five years, not one snapshot. CFI recommends checking multi-year patterns specifically to avoid being misled by a single volatile year.
- Watch for dividends funded by new debt issuance rather than operating cash flow. That shows up in the financing section of the cash flow statement.
- Be suspicious of rapid dividend increases paired with declining free cash flow. That combination often precedes a cut.
Pro Tip: Pull up a company's free cash flow trend alongside its payout ratio. If free cash flow is shrinking while the payout ratio climbs, that dividend is running on borrowed time, not borrowed money.
A Practical Checklist Before You Trust a Payout Ratio
Turning payout ratio analysis into an actual buy, hold, or avoid decision takes a short, repeatable process. Here's the workflow worth running on every dividend stock you're considering.
- Calculate the payout ratio using TTM figures: DPS ÷ EPS or Total Dividends ÷ Net Income.
- Check the five-year trend. Is the ratio stable, rising gradually, or spiking suddenly?
- Compare it to the free cash flow payout ratio. A big gap between the two is worth investigating.
- Check the balance sheet. Rising debt alongside a rising payout ratio is a warning sign, not a coincidence.
- Benchmark against sector peers, not the market average, since a REIT and a chipmaker have nothing in common on this metric.
- Ask what happens in a downturn. Does the company have enough cushion to maintain the dividend through a bad year or two?
Pro Tip: If you're screening across dozens of stocks at once, set a hard cutoff, say, no payout ratio above 75% outside of utilities and REITs, and let anything above that trigger a manual review instead of an automatic pass.
How Oracle Investments Helps You Run This Analysis Faster
Running this checklist by hand across a full watch list gets tedious fast, which is why some tools are built to help investors close this gap. Certain apps score stocks on profitability, valuation, and financial health, pulling in fundamentals like EPS, net income, and dividend history that feed directly into payout ratio analysis.
- Side-by-side comparison tools let you check a payout ratio trend against a peer's, without opening multiple separate filings.
- Educational content often draws on principles from legendary investors, framing payout ratio and dividend sustainability the way long-term value investors think about it.
- Portfolio tracking can flag changes in a holding's fundamentals, useful if a payout ratio you checked months ago has since drifted upward.
For the valuation side of the equation, it's worth reading up on how the PEG ratio and price to earnings ratio interact with dividend policy before locking in a decision.
How Payout Ratios Have Shifted Over the Decades
Corporate dividend policy has gone through real structural change since the mid-20th century, and understanding that shift explains a lot about why payout ratios look different today than they did for your grandparents' generation.
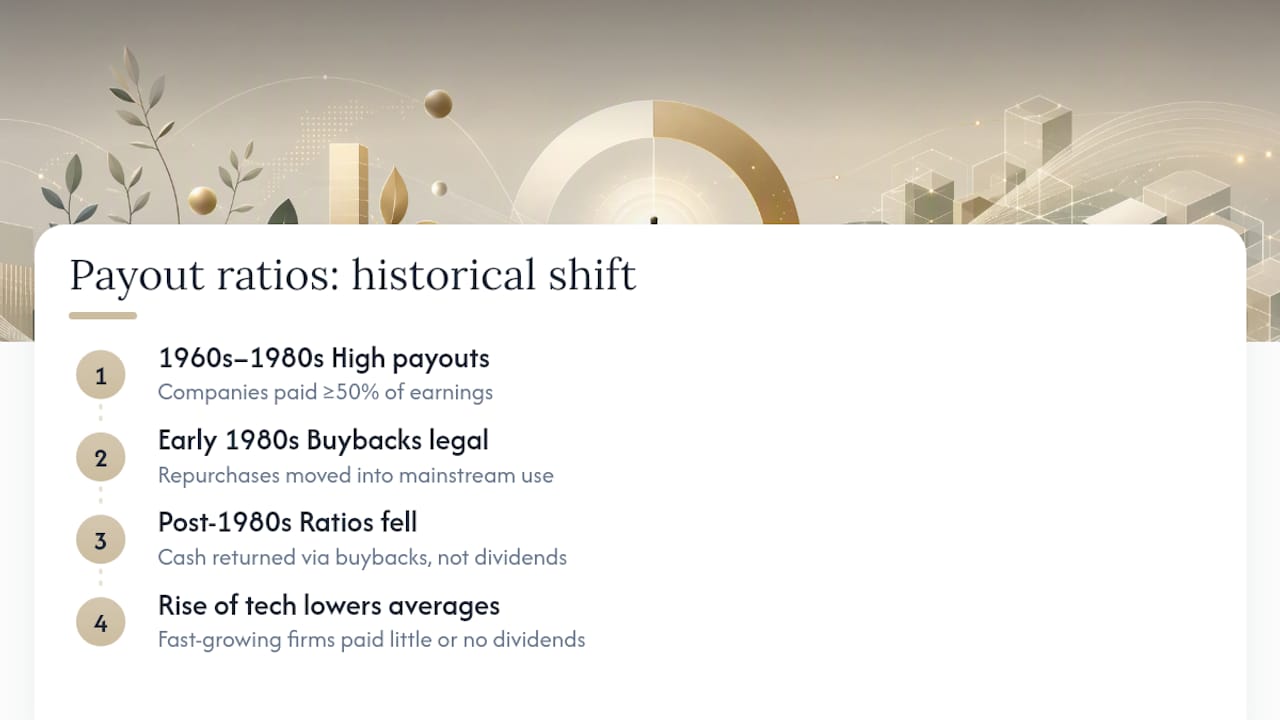
Through the 1960s and into the 1980s, high payout ratios were the norm across most of the US market. Companies routinely distributed 50% or more of earnings, and dividends were the primary way shareholders got paid. Stock buybacks were rare and, until regulatory changes in the early 1980s, existed in more of a legal gray area.
That changed as buybacks became a mainstream capital allocation tool. Rather than raising dividends, many companies began returning cash through repurchases instead, which quietly pushed plain dividend payout ratios lower across whole sectors, even as total shareholder returns held steady or climbed. This is precisely why the augmented payout ratio matters more now than it did decades ago.
The rise of the technology sector added another layer. Fast-growing tech companies historically paid minimal or no dividends, preferring to reinvest everything into expansion. As tech's weight in major indexes grew, it dragged down average market-wide payout ratios, even though individual mature companies within older sectors kept their payout policies largely unchanged. Reading a payout ratio in isolation, without this historical backdrop, risks assuming today's lower averages mean less shareholder-friendly behavior. Often it means the opposite, just delivered differently.
Why Company Lifecycle Stage Changes What's Normal
A company's stage in its lifecycle probably predicts its payout ratio better than any other single factor, and skipping this context is where a lot of novice payout ratio analysis goes wrong.
Early-stage and high-growth companies typically retain nearly all earnings, or operate at a loss entirely, because every dollar reinvested in product development, market expansion, or capacity building generates a higher return than a dividend check would. A 0% payout ratio at this stage isn't a weakness. It's the correct capital allocation decision.
As companies mature and growth opportunities become scarcer relative to the cash they generate, payout ratios climb. This is the phase where dividend initiation frequently happens for the first time.
A high payout ratio here reflects capital discipline, not desperation, provided the underlying cash flow supports it. The mistake is applying a young company's benchmark to an old company, or vice versa.
How the Economy Pushes Payout Ratios Up or Down
Macroeconomic conditions move payout ratios in ways that have nothing to do with any single company's individual performance, and it's worth separating that noise from real company-specific signals.
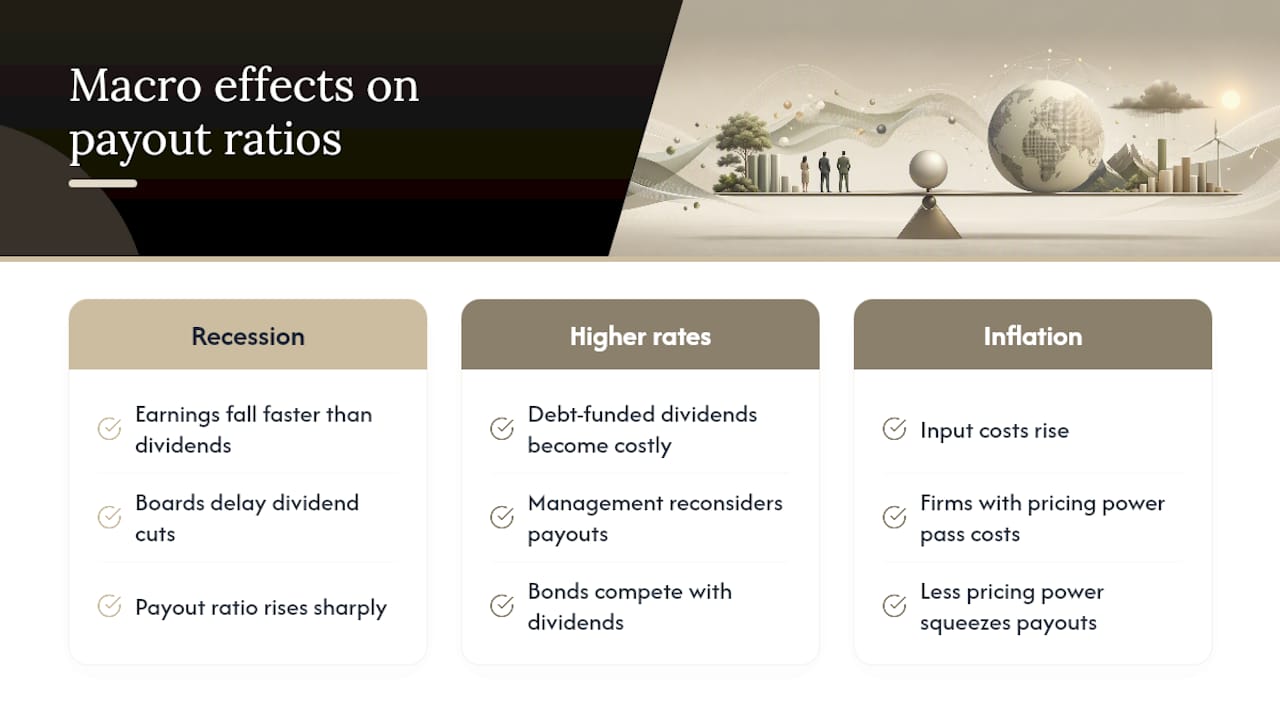
During recessions, net income tends to fall faster than dividend payments, since boards are often reluctant to cut a dividend immediately even as earnings shrink. That mechanically pushes payout ratios higher, sometimes sharply, even when a company hasn't changed its dividend policy at all. A payout ratio spike during a downturn often says more about the denominator (earnings) than the numerator (dividends).
Interest rate environments matter too. When borrowing costs rise, companies that had been funding dividends partly through debt face a harder choice, and payout ratios can come under pressure as management reassesses whether debt-funded distributions still make sense. Higher rates also make bonds more competitive with dividend stocks for income seekers, which can pressure companies to defend attractive yields even when earnings growth slows.
Inflation affects the equation from the input-cost side. Companies with pricing power that can pass rising costs on to customers tend to protect their payout ratios better than those squeezed between rising expenses and fixed dividend commitments. This is one more reason a single year's payout ratio, viewed without economic context, can send a misleading signal about a company's underlying discipline.
Payout Ratio vs. Free Cash Flow Payout Ratio
The plain payout ratio uses net income, an accounting figure shaped by depreciation schedules, tax timing, and non-cash charges. The free cash flow payout ratio swaps that denominator for free cash flow, operating cash flow minus capital expenditures, which more closely tracks the actual cash available to fund a dividend.
The two ratios usually move together, but when they diverge, that gap tells you something the net-income figure alone hides. A company with heavy depreciation charges (common in capital-intensive industries like telecom or energy infrastructure) might show a payout ratio that looks stretched on net income but comfortable on free cash flow, since depreciation reduces reported earnings without using any actual cash. The reverse happens too: a company with light depreciation but heavy real capital spending can show a deceptively low net-income payout ratio while its free cash flow payout ratio tells a tighter story.
Neither ratio alone is definitive. Running both side by side, and understanding what drives the gap between reported earnings and free cash flow, gives a far more complete sustainability picture than either number in isolation. When the two ratios tell wildly different stories, that divergence itself is the signal worth investigating before it shows up in the dividend history.
What I've Learned Trusting (and Distrusting) This Number
My rule with payout ratio is simple: it's a screening tool, not a verdict. If a stock clears my payout ratio check, that just earns it a second look, not a purchase.
The number I actually weight more heavily is the multi-year trend paired against free cash flow, because a payout ratio calculated on a single year's net income can be wrong in either direction, flattering a company that just took a one-time charge, or flattering a company that's about to.
Pair the payout ratio with a genuine look at the balance sheet and income statement details before you decide anything. A dividend stock that looks safe on payout ratio alone but funds its distribution with rising debt isn't actually safe. It's just patient about revealing the problem.
— Matt
Primary Sources and Further Reading
The formulas and benchmarks in this article draw on Wikipedia's dividend payout ratio overview, Investopedia's payout ratio benchmarks, Corporate Finance Institute's formula guide, and Wall Street Prep's worked calculator.
For related valuation context, see this explainer on the P/E ratio, and for hands-on stock scoring that folds payout ratio into a broader fundamental check, visit Oracle Investments.
Sources
- Dividend payout ratio — Wikipedia
- Dividend Payout Ratio: Definition, Formula, and Key Insights — Investopedia
- Dividend Payout Ratio - Definition, Formula, Guide — Corporate Finance Institute
- Dividend Payout Ratio | Formula + Calculator — Wall Street Prep