
The debt-to-equity ratio tells you, in a single number, how much a company leans on borrowed money versus its own capital. Calculated by dividing total liabilities by shareholders' equity, it sits at the center of any serious financial leverage analysis. A ratio of 1.0 means creditors and shareholders hold equal stakes in the business. Go above that, and debt is doing more of the heavy lifting. The number comes straight from the balance sheet, making it one of the most accessible capital structure ratios available to any investor.
A few things the ratio reveals at a glance:
- How aggressively a company finances growth with debt
- The relative claims creditors hold versus shareholders
- Whether management is using leverage to amplify returns or simply covering operating shortfalls
- The company's exposure to interest rate changes and credit risk
How to calculate the debt-to-equity ratio
The formula is straightforward: Debt-to-equity ratio = Total liabilities ÷ Shareholders' equity. Both figures come from the balance sheet. Here is how to work through it step by step.
- Locate total liabilities. This includes long-term debt (bonds, mortgages, term loans) and short-term debt (lines of credit, current portion of long-term debt). Exclude operating liabilities like accounts payable and accrued expenses when you want a cleaner picture of financial leverage.
- Find shareholders' equity. This is total assets minus total liabilities, reported directly on the balance sheet as common stock, retained earnings, and additional paid-in capital combined.
- Run the calculation. Say a company carries $800,000 in total liabilities and $400,000 in shareholders' equity. The ratio is $800,000 ÷ $400,000 = 2.0.
- Consider the long-term debt variation. Long-term debt is often preferred for ratio analysis because it isolates structural leverage from short-term operational liabilities that carry no interest. Using only long-term debt in the numerator gives a more conservative read on true financing risk.
- Interpret the result in context. A 2.0 ratio means the company owes $2 in debt for every $1 of equity. Whether that is acceptable depends entirely on the industry, which the next section covers.
Pro Tip: Always check whether a company's total liabilities figure includes operating leases under ASC 842. Since 2019, U.S. GAAP requires most leases on the balance sheet, which can inflate the ratio for retailers and airlines without reflecting new borrowing.
How to interpret what the ratio actually tells you
Ratio levels carry different signals depending on where a company sits in its industry.
- Below 1.0 suggests conservative financing. The company relies more on equity than debt, which reduces bankruptcy risk but may also mean it is not using cheap debt to grow as fast as it could.
- Around 1.0–2.0 is the range most analysts consider moderate for many sectors. The company uses debt, but equity still provides a meaningful cushion for creditors.
- Above 2.0 starts to raise flags in most industries. Fixed interest obligations grow relative to the equity base, and a revenue dip can quickly strain cash flow.
- Approaching 5, 6, or 7 tends to trigger lender scrutiny, regardless of sector. At those levels, even modest earnings volatility can threaten debt service.
- Negative ratio occurs when shareholders' equity turns negative, a sign of potential insolvency that goes well beyond ordinary leverage risk.
Context is everything. Capital-intensive industries like utilities and banking routinely operate with ratios that would alarm investors in a software company. A utility with a ratio of 3.0 may be perfectly healthy; a tech startup at the same level warrants a much harder look.
A higher ratio signals greater financial risk because interest payments are fixed obligations. Miss them, and the consequences are severe regardless of how strong the underlying business might be. On the other end, a very low ratio can indicate a company is leaving tax advantages and growth capital on the table, since interest payments are tax-deductible and debt is often cheaper than equity.

Pro Tip: Never compare ratios across different industries. A ratio that looks dangerous for a consumer goods company may be standard for a bank. Always benchmark within sector peers for an accurate read.
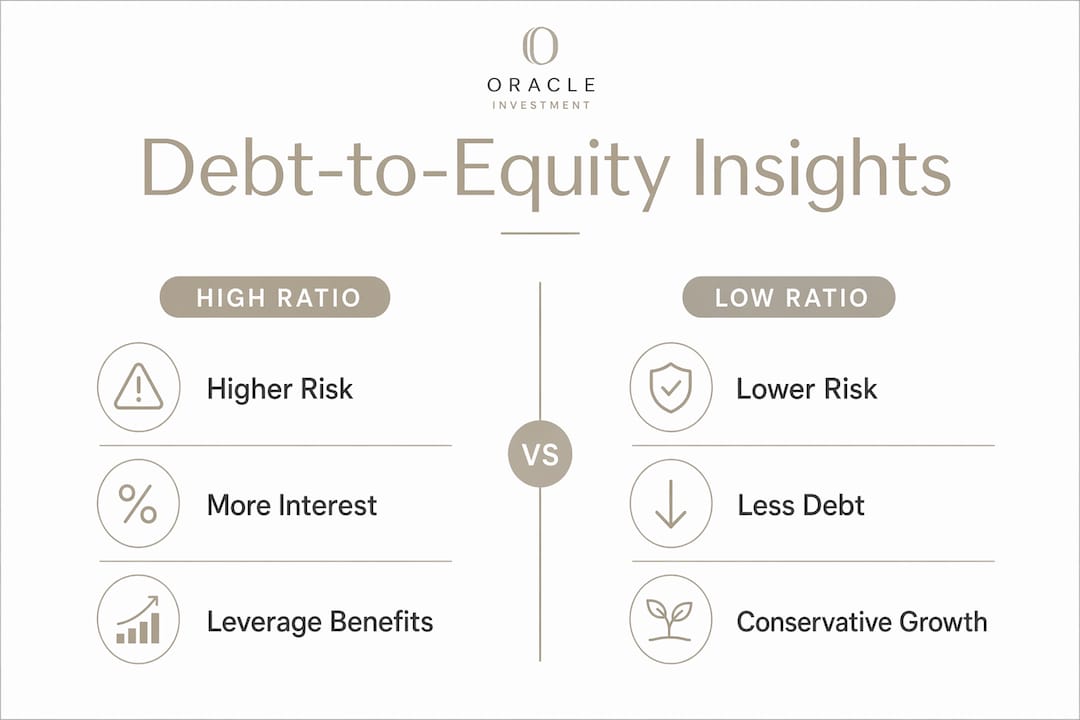
Benefits and drawbacks of a high debt-to-equity ratio
High leverage is not automatically bad. The outcome depends on what the debt is funding and whether cash flow can service it.
Benefits:
- Debt amplifies shareholder returns when the return on assets exceeds the cost of borrowing. A company earning 12% on assets funded partly by 6% debt keeps the spread as profit for equity holders.
- Interest expense is tax-deductible under U.S. tax law, reducing the effective cost of debt financing compared to issuing new equity.
- Debt allows companies to fund expansion without diluting existing shareholders, preserving earnings per share.
Drawbacks:
- Fixed interest obligations do not shrink when revenue falls. A company with thin margins and high debt can tip into distress quickly during a downturn.
- High leverage raises the breakeven point. More revenue must flow in just to cover interest before a dollar of profit appears.
- Lenders and bond markets price in higher risk through elevated interest rates for heavily leveraged borrowers, compounding the cost over time.
- Sudden ratio spikes from new capital investments are not always distress signals, but they do attract scrutiny from creditors who want to see cash flow projections that support the new debt load.
The distinction between productive leverage and reckless borrowing comes down to cash flow coverage. Debt that funds assets generating returns above the interest rate strengthens a business. Debt that covers operating losses is a different problem entirely.
How investors use the ratio in real financial analysis
The debt-to-equity ratio earns its place in investment analysis because it is fast, comparable, and grounded in audited balance sheet data. Here is how analysts actually put it to work.
- Screen for relative risk within a sector. When comparing two manufacturers, the one with a ratio of 0.8 versus a peer at 2.5 carries meaningfully less financial risk, all else equal. That gap often explains differences in credit ratings and borrowing costs.
- Track changes over time. A ratio climbing steadily over three years tells a different story than a one-year spike. Gradual increases may reflect deliberate growth financing; a sudden jump warrants a look at what was borrowed and why.
- Pair it with coverage ratios. The debt-to-equity ratio shows the stock of debt relative to equity, but it says nothing about whether earnings can service that debt. Combining it with interest coverage (EBIT divided by interest expense) or net debt to EBITDA gives a fuller picture of actual repayment capacity.
- Assess management's capital allocation discipline. Companies that maintain a consistent ratio while growing revenue are generally using debt purposefully. Ratios that balloon without corresponding revenue growth suggest something else is going on.
- Use industry benchmarks as your baseline. Sector-level debt-to-equity benchmarks show what is normal for a given business model, which is the only valid comparison point.
Pro Tip: The Oracleinvestments app scores over 260 stocks on financial health, including leverage metrics, so you can assess company fundamentals in seconds rather than pulling balance sheets manually.

Oracleinvestments puts this kind of analysis in your pocket. The app scores stocks on profitability, valuation, and financial health, drawing on the same principles Warren Buffett and Peter Lynch built careers on. Start analyzing stocks the way professionals do, without the spreadsheet work.

Key Takeaways
The debt-to-equity ratio is most useful when read alongside industry benchmarks, coverage ratios, and trend data rather than as a standalone number.
| Point | Details |
|---|---|
| Core formula | Divide total liabilities by shareholders' equity; a ratio of 1.0 means equal creditor and shareholder stakes. |
| Long-term debt variation | Using only long-term debt in the numerator isolates structural leverage from short-term operational liabilities. |
| Industry context is required | Ratios above 2.0 may be normal for utilities and banks but signal risk for tech or consumer companies. |
| High leverage cuts both ways | Debt amplifies returns when borrowing costs are below asset returns, but fixed payments become a liability in downturns. |
| Pair with coverage metrics | Combine the ratio with interest coverage or net debt to EBITDA for a complete picture of repayment capacity. |