
The PEG ratio is defined as a stock's price-to-earnings (P/E) ratio divided by its expected annual earnings per share (EPS) growth rate. This single number tells you whether a stock's price is justified by its growth prospects. A PEG near 1.0 signals fair valuation, below 1.0 suggests undervaluation, and above 1.0 may indicate a premium price. The PEG ratio explained simply: it upgrades the P/E ratio by adding growth into the equation, giving investors a more complete picture of what they are actually paying for.
How is the PEG ratio calculated and interpreted?
The PEG ratio formula is straightforward: PEG = P/E ratio ÷ expected EPS growth rate (%). Each component carries weight. The P/E ratio compares a stock's current price to its earnings per share. The growth rate reflects how fast those earnings are expected to rise, typically over the next one to five years.
Step-by-step PEG calculation
- Find the P/E ratio. Divide the current stock price by the trailing or forward EPS. A stock trading at $50 with EPS of $2.50 has a P/E of 20.
- Identify the expected EPS growth rate. Use analyst consensus estimates or the company's own guidance. Express this as a percentage, not a decimal.
- Divide P/E by the growth rate. A P/E of 20 with a 20% growth rate gives a PEG of 1.0.
- Interpret the result. PEG below 1.0 points to potential undervaluation. PEG above 1.0 suggests the market is pricing in optimism beyond current growth.
A concrete comparison makes this clearer. Company A has a P/E of 30 and 20% growth, giving a PEG of 1.5. Company B has a P/E of 25 and 25% growth, giving a PEG of 1.0. Company B looks more fairly valued despite having a lower P/E than Company A. This is exactly the insight the P/E ratio alone cannot deliver.
Two companies with identical P/E ratios can have very different PEGs depending on their growth trajectories. That gap is where real valuation insight lives.

Some analysts prefer the PEG ratio using a 5-year EPS growth estimate to smooth out short-term earnings swings. This longer-horizon version suits investors screening for durable growth rather than a single-year spike.
Pro Tip: Always confirm whether the growth rate used is forward-looking (analyst estimates) or historical. Forward PEG is generally more useful for growth stock evaluation, but it carries more uncertainty.
What are good PEG ratio benchmarks across different industry sectors?
A PEG of 1.0 is the classic benchmark, but applying it universally is a mistake. Applying a uniform PEG benchmark across industries is misleading because growth rates and business cycles differ sharply from one sector to the next.
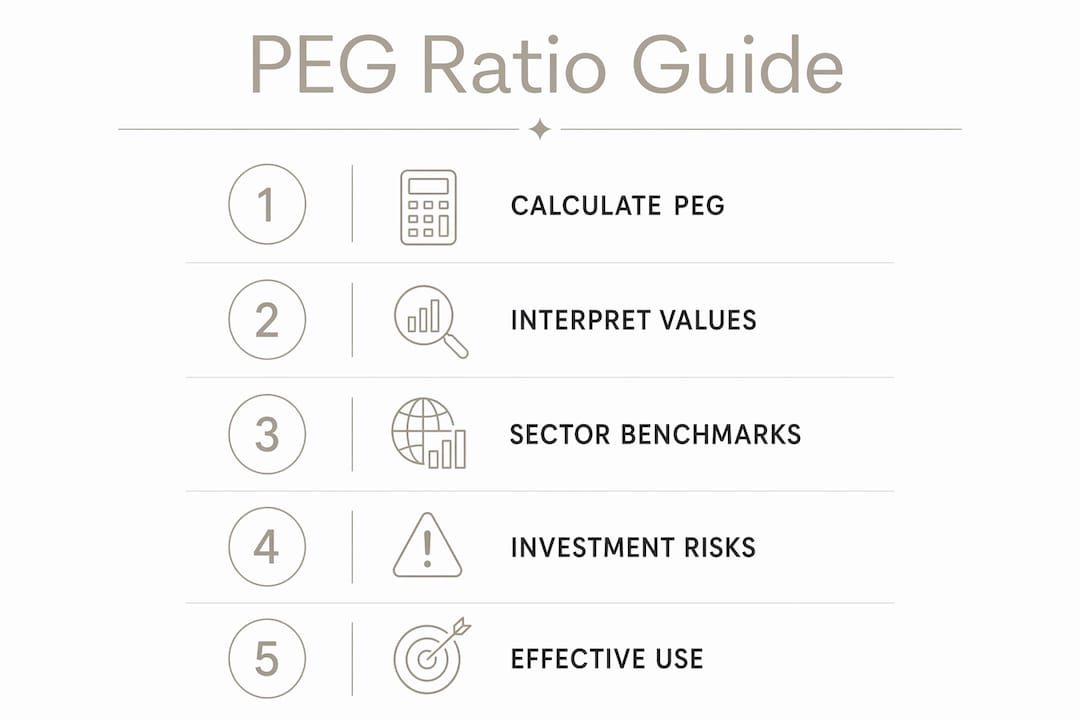
Here is why sector context matters. A technology company growing earnings at 30% per year commands a higher valuation multiple than a utility company growing at 4%. Investors accept a higher PEG for tech because the growth is real and sustained. A utility stock with a PEG of 1.5 would look expensive. A tech stock with the same PEG might look reasonable.
| Sector | Typical PEG range | Interpretation |
|---|---|---|
| Technology | 1.0–1.8 | Higher growth expectations justify premium PEG |
| Healthcare | 1.0–1.5 | Moderate growth with regulatory risk factored in |
| Consumer staples | 0.8–1.2 | Stable but slow growth; lower PEG expected |
| Banking and financials | 0.7–1.2 | Earnings tied to interest cycles; lower range typical |
| Commodities and energy | 0.5–1.0 | Cyclical earnings distort PEG; use with caution |
The technology sector PEG typically ranges between 1.0 and 1.8, reflecting the market's willingness to pay for high growth. That same range would signal overvaluation in consumer staples or banking.
Key points to keep in mind when reading sector benchmarks:
- A low PEG in a commodity stock may reflect earnings volatility, not genuine undervaluation.
- Consumer staples stocks with PEGs near 1.0 are often considered fairly valued given their predictable but modest growth.
- Healthcare PEG ranges account for pipeline uncertainty and regulatory approval timelines.
- Banking PEGs tend to compress during rising interest rate environments when earnings become harder to forecast.
Cyclical industries often show distorted PEG values because their earnings swing sharply with economic conditions. A mining company might show a PEG of 0.4 during a commodity boom and 3.0 during a bust. Neither number tells the full story.
What are the limitations and risks of using the PEG ratio?
The PEG ratio's biggest weakness is its dependence on earnings growth forecasts. Market analysts emphasize skepticism about growth forecasts used in PEG calculations because those projections are inherently uncertain. An overly optimistic growth estimate produces an artificially low PEG, making an expensive stock look cheap.
The ratio also ignores debt levels, cash flow quality, and management effectiveness. A company with a PEG of 0.8 might carry a debt load that threatens its ability to sustain that growth. The ratio tells you nothing about that risk.
Common pitfalls investors encounter with the PEG ratio:
- Cyclical stocks. Earnings for energy, mining, and industrial companies swing with economic cycles. A single-year growth estimate can be wildly off, making the PEG unreliable.
- Negative EPS. Companies reporting losses produce a negative or undefined PEG. The formula simply does not work in this case.
- Slow-growth value stocks. A low P/E stock with slow growth can have a high PEG, making it look expensive even when it is a solid business. The ratio penalizes stability.
- Analyst forecast bias. Sell-side analysts historically skew earnings estimates upward. That optimism feeds directly into PEG calculations.
- No dividend adjustment. The standard PEG ignores dividend yield. A modified version called the PEGY ratio adds yield to the growth rate, but it is less commonly used.
A low PEG alone does not guarantee investment quality. Structural risks, weak balance sheets, and poor cash flow can all hide behind an attractive number.
Pro Tip: Before acting on a low PEG, check the company's debt-to-equity ratio and free cash flow trend. A stock that looks cheap on PEG but burns cash is not a bargain.
Avoiding common value investing mistakes means treating the PEG as one input in a broader checklist, not a final verdict.
How can individual investors apply the PEG ratio effectively?
The PEG ratio works best as a screening tool, not a buy signal. Used correctly, it narrows a large universe of stocks down to candidates worth deeper research. Here is a practical process for applying it.
- Screen within a single sector. Compare PEG ratios only among companies in the same industry. A tech stock with a PEG of 1.2 and a utility stock with a PEG of 1.2 are not equally attractive. Sector context defines what is reasonable.
- Source your growth estimates carefully. Use consensus analyst estimates from financial data platforms rather than company guidance alone. Management forecasts carry obvious bias.
- Pair PEG with balance sheet strength. A stock with a PEG of 0.9 and a clean balance sheet is far more interesting than one with a PEG of 0.9 and heavy debt. Learning how to read a value rating helps you combine these signals efficiently.
- Check earnings visibility. Companies with recurring revenue models produce more reliable EPS forecasts. Software-as-a-service businesses, for example, have more predictable earnings than project-based manufacturers.
- Use the 5-year PEG for growth stocks. Short-term EPS estimates for high-growth companies fluctuate sharply. The 5-year version smooths those swings and gives a more stable valuation signal.
PEG ratio helps investors find growth stocks fairly valued relative to their expected earnings increase. The key word is "relative." It is a comparison tool, not an absolute measure of worth.
A practical example: you are comparing two software companies. Company X has a P/E of 35 and projected EPS growth of 28%, giving a PEG of 1.25. Company Y has a P/E of 40 and projected EPS growth of 45%, giving a PEG of 0.89. On a PEG basis, Company Y looks more attractive despite its higher P/E. But you still need to check whether that 45% growth forecast is realistic before acting.
Experts caution investors not to treat PEG as a rigid rule but as a heuristic tool combined with qualitative factors. The investors who use it well treat it as a starting point, not a conclusion.
Key Takeaways
The PEG ratio is the most practical single metric for comparing a stock's price to its growth potential, but it only delivers reliable signals when used within sector context and alongside balance sheet analysis.
| Point | Details |
|---|---|
| Core formula | Divide the P/E ratio by the expected EPS growth rate to get the PEG. |
| Benchmark interpretation | A PEG near 1.0 signals fair value; below 1.0 suggests undervaluation. |
| Sector benchmarks vary | Technology accepts PEGs of 1.0–1.8; consumer staples and banking run lower. |
| Key limitation | PEG ignores debt, cash flow quality, and relies on uncertain growth forecasts. |
| Best practice | Always compare PEG within the same sector and pair it with balance sheet data. |
Why I think most investors misuse the PEG ratio
Most investors treat the PEG ratio like a pass/fail test. If the number is below 1.0, they buy. If it is above 1.5, they pass. That approach misses the entire point of the metric.
The PEG ratio is a relative tool. Its value comes from comparison, not from the absolute number. I have seen investors dismiss a stock with a PEG of 1.4 in the technology sector while chasing a commodity stock with a PEG of 0.6, not realizing the commodity company's earnings were at a cyclical peak and about to collapse.
The other misconception I encounter constantly is treating analyst growth forecasts as facts. They are not. They are educated guesses, and they skew optimistic. When you plug an inflated growth rate into the PEG formula, you get a number that flatters the stock. The ratio looks great right up until the earnings miss.
What actually works is using PEG as a filter, not a verdict. Screen for stocks with PEGs below the sector average. Then dig into the balance sheet, the earnings quality, and the competitive position. The PEG gets you to the right neighborhood. Fundamental analysis tells you which house to buy.
The investors who use PEG well, in the tradition of Peter Lynch who popularized the metric, always ask one follow-up question: is that growth rate realistic? If the answer is yes and the balance sheet is clean, you have something worth examining closely.
— Matt
How Oracleinvestments makes PEG analysis faster
Calculating PEG ratios manually across dozens of stocks takes time. Oracleinvestments scores over 260 stocks based on key fundamentals including valuation, profitability, and financial health, so you can see which stocks look attractive on a growth-adjusted basis without building spreadsheets from scratch.

The platform draws on the investment frameworks of Warren Buffett, Charlie Munger, and Peter Lynch, the investor who made the PEG ratio famous. You get real-time portfolio tracking, side-by-side stock comparisons, and a scoring system that puts PEG-style thinking into a format any investor can act on. Visit Oracleinvestments to start evaluating stocks the way professional analysts do, without the complexity.
FAQ
What is the PEG ratio in simple terms?
The PEG ratio measures whether a stock's price is justified by its earnings growth. You calculate it by dividing the P/E ratio by the expected annual EPS growth rate.
What is a good PEG ratio for a stock?
A PEG ratio near 1.0 is generally considered fair value. Below 1.0 may indicate undervaluation, but the right benchmark depends on the sector.
How does the PEG ratio differ from the P/E ratio?
The P/E ratio compares price to current earnings. The PEG ratio adds expected growth, making it more forward-looking and useful for evaluating growth stocks.
Can the PEG ratio be negative?
Yes. If a company has negative EPS or negative projected growth, the PEG ratio becomes negative or undefined, making it useless as a valuation tool in those cases.
Why does the PEG ratio vary by sector?
Growth expectations and earnings stability differ across industries. Technology companies justify higher PEG ratios because of faster growth, while stable sectors like consumer staples trade at lower PEG ranges.