
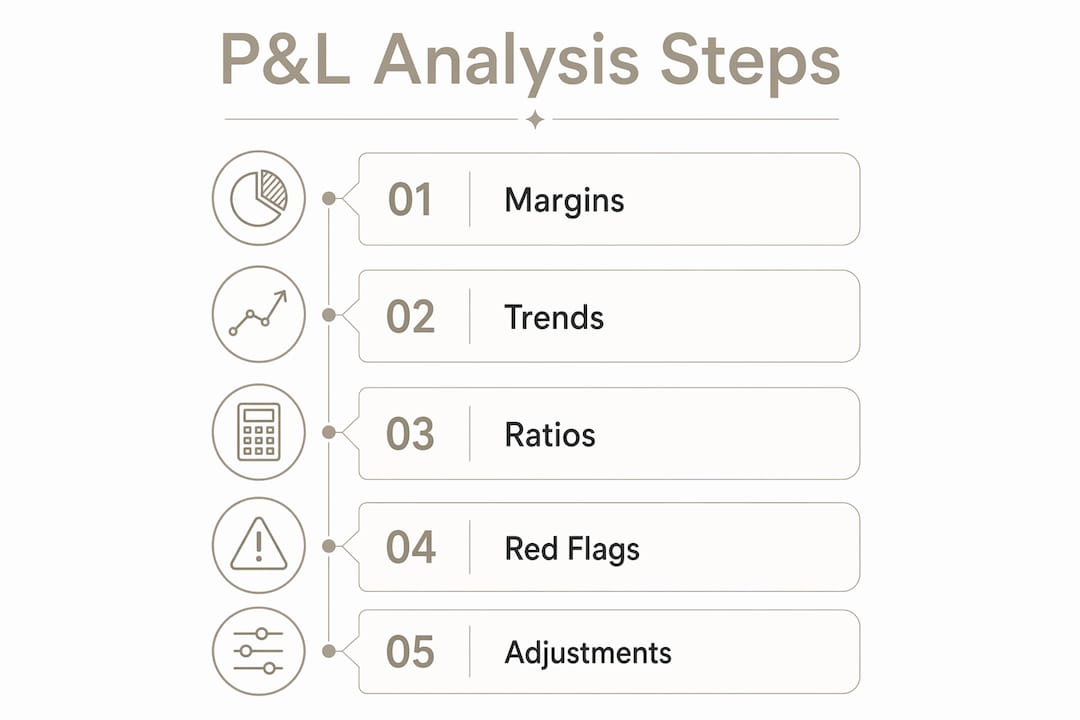
Income statement analysis measures how much revenue a company keeps after every layer of costs, and whether that pattern is improving or deteriorating over time. Three checks cover the essentials: a common-size (vertical) check that converts every line to a percentage of revenue, a horizontal trend check that tracks year-over-year changes, and a ratio check that reconciles reported profit with actual cash generation.
Start with these four numbers before anything else:
- Revenue growth rate: (Current revenue − Prior revenue) ÷ Prior revenue
- Gross margin: Gross profit ÷ Revenue
- Operating margin: Operating income ÷ Revenue
- Operating cash flow vs. net income: If cash lags profit by more than a quarter or two, dig into receivables and deferred revenue
That three-step workflow, applied consistently, catches most of what matters before you spend an hour reading footnotes.
Table of Contents
- What does an income statement actually tell investors?
- A line-by-line guide to the key components
- How the income statement connects to the other two statements
- How to analyze an income statement step by step
- Worked example: calculating margins and trends on a sample P&L
- Red flags, adjustments, and the limits of P&L analysis
- How investors and managers use P&L analysis in practice
- A repeatable P&L checklist and how to score it
- Understanding unusual items: extraordinary gains, losses, and discontinued operations
- How segment reporting changes the picture
- How revenue recognition policies affect what you read
- Tax rates, deferred taxes, and what they mean for profitability
- Key Takeaways
- The part of income statement analysis most guides skip
- Oracleinvestments puts a P&L score in your hands instantly
- Authoritative sources for further reading
What does an income statement actually tell investors?
The income statement, also called the profit and loss statement (P&L), summarizes a company's revenues, costs, and profits over a defined period, typically a quarter or a fiscal year. Its primary job is to show whether the business earned more than it spent and by how much. For investors, the CFA Institute curriculum treats revenue growth, operating margin, and earnings per share as core inputs for valuation and credit research, not just scorecard items.
The income statement answers three practical questions: Is revenue growing? Are margins expanding or shrinking? And are earnings driven by the core business or by one-time events? What it cannot answer alone is whether the company is generating real cash, because accrual accounting records revenue when earned, not when collected. That gap between profit and cash is why the cash flow statement always needs a second look.
Key questions the P&L answers at a glance:
- Is the top line growing faster or slower than costs?
- Which expense category is consuming the most margin?
- Are earnings per share rising because the business is more profitable, or because shares outstanding are shrinking?
A line-by-line guide to the key components
Every income statement runs top-down from revenue to net income. Here is what each line means and the quick formula to compute it.
- Revenue (Net Sales): Total income from goods or services sold. Watch for organic growth vs. acquisition-driven growth.
- Cost of Goods Sold (COGS): Direct production costs. Formula: Beginning inventory + Purchases − Ending inventory. Rising COGS as a share of revenue signals pricing pressure or input-cost inflation.
- Gross Profit: Revenue − COGS. The first test of pricing power.
- Gross Margin: Gross profit ÷ Revenue. A shrinking gross margin is often the earliest warning sign.
- Operating Expenses (SG&A, R&D): Indirect costs to run the business. SG&A rising faster than revenue is a classic red flag.
- Depreciation & Amortization (D&A): Non-cash charge for asset wear. Separating it out reveals EBITDA.
- Operating Income (EBIT): Gross profit − Operating expenses − D&A. Measures core business profitability before financing costs.
- Operating Margin: EBIT ÷ Revenue. The most reliable single-period profitability gauge.
- EBITDA Margin: EBITDA ÷ Revenue, where EBITDA = EBIT + D&A. Useful for capital-intensive comparisons, but never a cash-flow substitute.
- Interest & Taxes: Interest expense reduces pre-tax income; the effective tax rate (taxes paid ÷ pre-tax income) can shift significantly quarter to quarter.
- Net Income: Revenue − All costs and taxes. The bottom line.
- Net Profit Margin: Net income ÷ Revenue.
- Earnings Per Share (EPS): Net income ÷ Weighted average shares outstanding. Diluted EPS includes options and convertibles.
How the income statement connects to the other two statements
Net income does not stay on the income statement. It flows directly into retained earnings on the balance sheet, increasing equity unless offset by dividends or buybacks. That link is why a company can report growing profits while its equity base erodes if it is paying out more than it earns.

The bigger practical gap is between net income and operating cash flow. Accrual accounting records revenue when a sale is made, not when cash arrives. If receivables are climbing faster than revenue, the company is booking sales it has not yet collected. Inventory build-up has the same effect: costs hit the balance sheet, not the income statement, until goods are sold. Deferred revenue works the other way, pulling cash in before revenue is recognized. Reconciling profit with cash flow is one of the most practical checks an investor can run.
Use the three statements together this way:
- Income statement: Identify the margin trend and the expense driver.
- Cash flow statement: Confirm whether operating cash flow tracks net income or diverges.
- Balance sheet: Check whether receivables, inventory, or debt are moving in ways that explain the divergence.
How to analyze an income statement step by step
The HBS approach to income statement analysis combines vertical and horizontal analysis so you see both structure and direction at once. Here is the full three-step process with formulas.
Step 1: Vertical (common-size) analysis
- Take each line item and divide it by total revenue for that period.
- Express the result as a percentage.
- Compare those percentages across periods or against industry peers.
A company with 60% gross margin and 15% operating margin has a very different cost structure than one with 35% gross margin and 12% operating margin, even if their net income dollars look similar. Vertical analysis makes that structural difference visible immediately.
Step 2: Horizontal (trend) analysis
- Select two or more periods (quarters or annual).
- Calculate: (Current period value − Prior period value) ÷ Prior period value × 100.
- Flag any line where the percentage change diverges from revenue growth by more than a few points.
Year-over-year comparisons smooth out seasonal noise. Sequential (quarter-over-quarter) comparisons catch inflection points faster. Use both. If revenue grew 20% year-over-year but SG&A grew 35%, that gap demands an explanation before you move on.
Step 3: Ratio and margin analysis
Compute these in order:
- Gross margin = Gross profit ÷ Revenue
- Operating margin = EBIT ÷ Revenue
- Net margin = Net income ÷ Revenue
- EBITDA margin = (EBIT + D&A) ÷ Revenue
- Revenue growth = (Current revenue − Prior revenue) ÷ Prior revenue
- EPS growth = (Current EPS − Prior EPS) ÷ Prior EPS
Pro Tip: Keep your primary trend in GAAP figures. When a company presents non-GAAP results, go line by line through the reconciliation rather than accepting the adjusted total. Stock-based compensation, restructuring charges, and acquisition-related amortization are the most common exclusions. If non-GAAP operating income is 30% higher than GAAP, that gap is part of the story, not a footnote.

Worked example: calculating margins and trends on a sample P&L
The table below uses a simplified two-year income statement for a hypothetical company, TechCo.
| Line Item | Year 1 ($M) | Year 2 ($M) | Common-Size Y1 | Common-Size Y2 | YoY Change |
|---|---|---|---|---|---|
| Revenue | 300 | 500 | 100% | 100% | +25.0% |
| COGS | 150 | 200 | 25.0% | 35.0% | +34.4% |
| Gross Profit | 200 | 250 | 60.0% | 57.0% | 25% |
| SG&A | 75 | 100 | 19.0% | 25.0% | +43.8% |
| R&D | 40 | 45 | — | — | +25.0% |
| D&A | 20 | 25 | — | — | +25.0% |
| Operating Income (EBIT) | 100 | 90 | 25.0% | 19.0% | -— |
| Interest & Taxes | 30 | 28 | — | — | — |
| Net Income | 65 | 60 | 19.0% | 25.0% | -4.3% |
Reading the numbers:
- Revenue grew 25%, which looks strong on the surface.
- Gross margin compressed from 60.0% to 57.0%, meaning COGS grew faster than revenue (+34.4% vs. +25.0%). That is the first warning.
- SG&A jumped 43.8%, far outpacing revenue. Operating income actually fell in absolute dollars despite a 25% revenue increase.
- Operating margin dropped from 25.0% to 19.0%, a 600 basis-point compression in a single year.
The takeaway from this example: Revenue growth that does not reach operating profit is a signal of expense pressure below gross profit. As TheFinSense notes, revenue up 25% with operating margin falling is the exact pattern that warrants a deeper look at SG&A and COGS drivers before drawing any conclusion about the company's health.
Red flags, adjustments, and the limits of P&L analysis
A well-formatted income statement can still mislead you. These are the warning signs worth checking on every filing.
Red flags to look for:
- Large one-time gains (asset sales, litigation settlements) inflating net income in a single period
- Frequent non-GAAP exclusions that grow larger each year
- Receivables or inventory growing faster than revenue for two or more consecutive quarters
- Falling cash conversion relative to reported operating income
- Gross margin shrinking while management attributes it to "temporary" factors, quarter after quarter
- SG&A rising persistently faster than revenue, a pattern consistent with cost stickiness research showing that costs fall more slowly than revenue when sales decline
Quick adjustments to make:
- Normalize net income by removing one-time items and recalculating margins on the adjusted base.
- Reconcile non-GAAP exclusions item by item. Stock-based compensation is a real cost; excluding it inflates the picture.
- When evaluating EPS growth, check whether shares outstanding declined. EBITDA and EPS can be influenced by buybacks without any improvement in underlying cash generation.
- Remove acquisition-related amortization only when comparing to pre-acquisition periods, and flag it clearly.
EBITDA is useful for cross-company comparisons in capital-intensive industries, but it excludes real cash costs. Always validate it against free cash flow before using it in a valuation model.
How investors and managers use P&L analysis in practice
The income statement is not just a report card. It feeds directly into screening, valuation, and operating decisions.
- Screening: Set minimum gross margin and operating margin thresholds to filter a universe of stocks. A company that has maintained gross margin above 40% for five consecutive years is a different animal than one that fluctuates between 25% and 45%. Track the consistency, not just the level.
- Valuation inputs: Sustainable revenue growth rates and normalized operating margins are the two most important inputs to a discounted cash flow model. If either is inflated by one-time items, the valuation output is wrong from the start.
- Performance monitoring: For managers, the operating expense ratio (total operating expenses ÷ revenue) and the SG&A ratio are the fastest indicators of cost discipline. A rising SG&A ratio in a flat-revenue environment is a decision point, not a footnote.
- Earnings quality check: Compare net income growth to operating cash flow growth over four to eight quarters. Persistent divergence is a signal to read the working-capital section of the cash flow statement before trusting the earnings trend.
A repeatable P&L checklist and how to score it
Run these ten checks on any income statement. Award one point for each pass.
- Revenue growth is positive and consistent over the last three to four periods.
- Gross margin is stable or expanding year-over-year.
- SG&A growth is below revenue growth.
- R&D spending is stable or growing as a share of revenue (for technology and life sciences companies).
- Operating margin is stable or expanding.
- Net income growth tracks operating income growth (no large below-the-line distortions).
- EPS growth is not primarily driven by share count reduction.
- Operating cash flow tracks net income within a reasonable range.
- Non-GAAP exclusions are small relative to GAAP income and declining over time.
- Effective tax rate is stable; large swings warrant a footnote check.
| Score | Interpretation | Next step |
|---|---|---|
| 8–10 | Pass | Proceed to valuation and balance-sheet review |
| 5–7 | Watch | Identify which checks failed; monitor next two quarters |
| 0–4 | Investigate | Dig into filings; high risk of earnings quality issues |
A spreadsheet handles this in minutes. An app like Oracleinvestments maps these fundamentals to an instant score across more than 260 stocks, which is useful when you are screening a large list and need to prioritize which filings to read first.
Understanding unusual items: extraordinary gains, losses, and discontinued operations
Before 2015, U.S. GAAP required companies to separately disclose "extraordinary items" below the line. The Financial Accounting Standards Board (FASB) eliminated that classification, but the underlying events still appear in filings under different labels: gains or losses on asset sales, impairment charges, restructuring costs, and discontinued operations.
Discontinued operations are particularly important to isolate. When a company sells a business segment, the income and expenses from that segment are reported separately, below operating income, so they do not distort the continuing business's margins. If you include discontinued-operations income in your trend analysis without flagging it, you will overstate the core business's profitability in the year of the sale and understate it in every comparison period.
The practical rule: always check whether the period you are analyzing includes a large below-the-line item. If it does, restate the prior period on the same basis before computing any trend percentage. Impairment charges deserve the same treatment. A $500 million goodwill write-down is a real economic event, but it is not a recurring operating cost, and leaving it in the trend distorts every margin calculation downstream.
How segment reporting changes the picture
A consolidated income statement hides as much as it reveals. A company with three business segments, one growing at 30%, one flat, and one declining, can report aggregate revenue growth of 10% that looks unremarkable until you see the mix. Segment disclosures, required under ASC 280 for U.S. public companies, break out revenue and operating profit by reportable segment.
When analyzing segment data, compute operating margin separately for each segment. A high-margin software segment subsidizing a low-margin hardware segment is a fundamentally different business than one where all segments earn similar margins. Margin divergence across segments also reveals where management is investing and where it is harvesting cash.
Watch for segment redefinitions. When a company redraws its segment boundaries, prior-period comparisons become unreliable unless restated. That redefinition itself is sometimes a signal: companies occasionally restructure segments to obscure a deteriorating unit inside a larger, healthier one.
How revenue recognition policies affect what you read
Revenue recognition is not uniform across companies or industries, and the differences matter for any trend analysis. Under ASC 606, the U.S. standard adopted in 2018, companies recognize revenue when performance obligations are satisfied, not necessarily when cash is received or a contract is signed.
For a software company selling annual subscriptions, this means revenue is recognized ratably over the subscription period. A spike in billings does not produce a matching revenue spike. Deferred revenue on the balance sheet, the cash collected but not yet recognized, is a leading indicator of future revenue. A growing deferred revenue balance is generally positive; a shrinking one can signal slowing new sales even when reported revenue looks stable.
For a construction company using percentage-of-completion accounting, revenue recognition depends on estimates of project progress. Those estimates introduce subjectivity. When you see large revenue reversals or restatements in construction or long-term contract businesses, percentage-of-completion assumptions are usually the place to start.
The CFA Institute guidance on analyzing income statements specifically flags revenue recognition as a key area where accounting choices can create comparability problems across companies in the same industry.
Tax rates, deferred taxes, and what they mean for profitability
The statutory U.S. corporate tax rate is 21%, but effective tax rates vary widely by company, industry, and year. A company reporting a 10% effective tax rate in one year and 28% the next has not become less profitable in the operating sense, but net income will look dramatically different. Always compute pre-tax income margin alongside net margin to separate operating performance from tax effects.
Deferred tax assets and liabilities arise from timing differences between GAAP accounting and tax accounting. A deferred tax asset means the company has paid taxes ahead of when GAAP recognizes the expense, and it expects a future tax benefit. A large, growing deferred tax asset that is never realized is a warning sign. Deferred tax liabilities are more common and generally benign, representing taxes owed in the future on income already recognized.
When a company's effective tax rate drops sharply, check the footnotes for one-time items: a valuation allowance release on deferred tax assets, a tax settlement, or a geographic income shift. These are real but non-recurring, and they inflate net income in the year they occur without improving the underlying business.
Key Takeaways
Consistent income statement analysis requires three repeatable checks: common-size margins, horizontal trend comparisons, and a cash-flow reconciliation that confirms whether reported profit is backed by real cash generation.
| Point | Details |
|---|---|
| Start with margins, not headlines | Gross margin and operating margin reveal cost structure faster than revenue growth alone. |
| Trend beats snapshot | Horizontal analysis over three to four periods shows whether margins are improving or compressing. |
| Profit does not equal cash | Always reconcile net income to operating cash flow; divergence signals a working-capital issue worth investigating. |
| Adjust before you compare | Normalize for one-time items, discontinued operations, and non-GAAP exclusions before computing any trend. |
| Oracleinvestments speeds screening | The app scores over 260 stocks on core fundamentals, helping investors prioritize which P&Ls to read in depth. |
The part of income statement analysis most guides skip
Most beginner guides treat the income statement as a static document. Read the numbers, compute the margins, done. That framing misses the most useful part of the analysis: the question of why a margin moved, not just that it moved.
Gross margin compression is not one problem. It is at least four: pricing pressure, input-cost inflation, product-mix shift toward lower-margin lines, or accounting changes in how costs are classified. Each has a different implication for the next quarter. A reader who stops at "gross margin fell 300 basis points" and moves on has done half the work.
The same applies to SG&A. Research on cost stickiness shows that selling and administrative costs tend to rise faster with revenue increases than they fall when revenue declines. That asymmetry means a company in a revenue downturn will almost always show operating margin compression even if management is cutting costs. The question is whether the cost structure is adjusting fast enough, and that requires looking at the rate of change, not the level.
One more thing beginners consistently underweight: footnotes. The management discussion and analysis section of a 10-K or 10-Q is where revenue recognition policies, segment changes, and non-recurring item explanations live. The income statement headline is a summary. The footnotes are the actual story. Skipping them is like reading only the subject line of an email and deciding you understand the thread.
A disciplined workflow looks like this: compute the margins, flag the changes, form a hypothesis about the cause, then go to the footnotes and segment disclosures to test it. That loop, not a single pass through the numbers, is what separates a useful analysis from a superficial one. For common value investing mistakes that stem from incomplete P&L reads, the pattern is almost always the same: the analyst trusted the headline and skipped the verification step.
Oracleinvestments puts a P&L score in your hands instantly
Running the ten-item checklist above manually across a watchlist of 30 stocks takes hours. Oracleinvestments compresses that process: the app scores over 260 stocks on core financial fundamentals, including profitability, valuation, and financial health, so you can see at a glance which companies pass the margin and growth checks before committing time to a full filing read.

The scoring draws on the same principles that Warren Buffett, Charlie Munger, and Peter Lynch built their frameworks around, mapped into criteria you can act on in seconds. Side-by-side comparisons let you see which company in a sector has the stronger margin profile without building a spreadsheet from scratch. Real-time portfolio tracking means you catch margin deterioration as it happens, not after the next earnings call.
Always verify the underlying numbers in the company's SEC filings. A score is a starting point, not a substitute for reading the actual P&L and its footnotes. Use Oracleinvestments to decide where to look, then do the reading. Start screening stocks now and see which companies on your list actually pass the fundamentals check.
Authoritative sources for further reading
- SEC EDGAR Beginner's Guide to Financial Statements: The SEC's own plain-language explanation of what each financial statement measures; the best starting point for understanding what the numbers are legally required to represent.
- CFA Institute: Analyzing Income Statements: Curriculum-level detail on revenue recognition, expense recognition, EPS calculation, and common-size analysis; the standard reference for professional analysts.
- HBS Online: Income Statement Analysis: Practical walkthrough of vertical and horizontal analysis with worked examples; well-suited for investors who want a structured how-to.
- TheFinSense: Income Statement Analysis — 5 Checks Beyond Revenue: A practitioner-focused checklist covering gross margin, SG&A behavior, cash reconciliation, and non-GAAP adjustments; the most actionable single-article reference in this list.
- LibreTexts: The Income Statement: Covers EBITDA caveats, EPS mechanics, and the three-pass reading method; good for building foundational fluency.
- Coursera: How to Analyze an Income Statement: Overview of horizontal, vertical, ratio, trend, and DuPont analysis methods; useful for understanding the full range of techniques before choosing which to apply.
- SEC EDGAR 10-K and 10-Q filings (primary source): For any company you are analyzing, the actual filing is the authoritative document. Read the Management Discussion and Analysis section and the notes to the financial statements for revenue recognition policies, segment changes, and one-time item explanations. No secondary source replaces the filing itself.