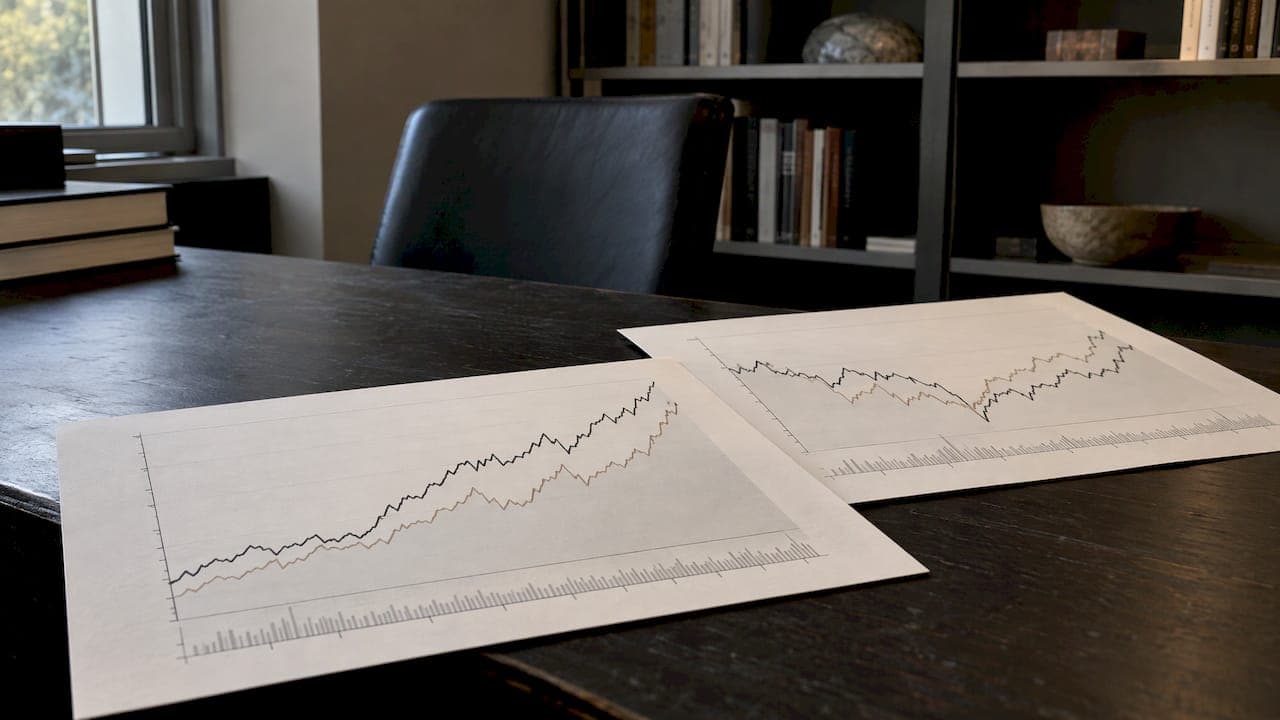
The upside capture ratio tells you what share of a benchmark's gains an investment captured during the periods when the benchmark rose. A reading of 100% means the investment matched the benchmark in up markets. Above 100% means it gained more. Below 100% means it gained less. On its own the number is only half the story, so this guide also covers the downside capture ratio, a worked example you can repeat, and the limits to keep in mind.
TL;DR
- Upside capture ratio compares a fund's return with its benchmark's return, using only the periods when the benchmark was positive.
- Above 100% means the fund gained more than the benchmark in up periods. Below 100% means it gained less.
- Always read it with the downside capture ratio. Dividing up capture by down capture gives a quick read on whether the fund's trade-off is favorable.
- Benchmark choice and time period change the answer, so match the benchmark to the fund's actual strategy.
- Pair capture ratios with Sharpe, Sortino and maximum drawdown rather than relying on one number.
Table of Contents
- What the upside capture ratio measures
- The formula
- A worked example
- How to read the number
- Match the pattern to your goal
- Limits to keep in mind
- Pair capture ratios with other measures
- A short checklist for using capture ratios
- Perspective
- Put fundamentals next to performance statistics
- FAQ
- Sources
What the upside capture ratio measures
Capture ratios describe how much an investment participates in benchmark moves. Upside capture looks at relative performance when the benchmark is positive. Downside capture looks at relative performance when the benchmark is negative. Morningstar's capture ratio paper defines them this way: the manager's performance relative to the benchmark when the benchmark rises, and when it falls.
Think of it as a question you ask of any fund: when the market went up, how much of that move did I actually get? Then the mirror question: when the market fell, how much of that fall did I take?
A fund that holds mostly defensive stocks will usually answer the first question with a number below 100% and the second with a number well below 100%. A fund built on high-growth names may do the opposite. Neither is automatically better. What matters is whether the pattern fits what you want from the holding.
The formula
The calculation takes four steps:
- Pick a benchmark that matches the fund's strategy and a time period, such as 3 or 5 years of monthly returns.
- Sort the months into two groups: months when the benchmark return was positive, and months when it was negative.
- For the up months, compound the fund's returns and compound the benchmark's returns separately.
- Divide the fund's compounded return by the benchmark's compounded return and multiply by 100.
In short: Upside capture = (fund compounded return in up months ÷ benchmark compounded return in the same months) × 100.
The compounded geometric returns method is the common approach for monthly data. Some systems work with daily data instead. Tamarac's data dictionary describes an implementation that uses daily fund returns on benchmark-positive days. Because the frequency and method differ, two sources can report slightly different capture ratios for the same fund. When you compare funds, use the same source, period and benchmark for each.
Downside capture uses the identical steps, applied to the months when the benchmark was negative.
A worked example
Here is an illustrative six-month example with made-up numbers, so you can follow the arithmetic.
| Month | Benchmark | Fund |
|---|---|---|
| Jan | +4% | +3% |
| Feb | -3% | -2% |
| Mar | +2% | +1.5% |
| Apr | -5% | -3% |
| May | +6% | +5% |
| Jun | -1% | -0.5% |
Up months (Jan, Mar, May).
- Benchmark compounded: 1.04 × 1.02 × 1.06 = 1.1244, a gain of about 12.44%.
- Fund compounded: 1.03 × 1.015 × 1.05 = 1.0977, a gain of about 9.77%.
- Upside capture: 9.77 ÷ 12.44 = about 78.5%.
Down months (Feb, Apr, Jun).
- Benchmark compounded: 0.97 × 0.95 × 0.99 = 0.9123, a loss of about 8.77%.
- Fund compounded: 0.98 × 0.97 × 0.995 = 0.9458, a loss of about 5.42%.
- Downside capture: 5.42 ÷ 8.77 = about 61.7%.
The fund kept roughly 78.5% of the benchmark's gains while absorbing roughly 61.7% of its losses. Dividing the two gives about 1.27. The overall capture ratio, up capture divided by down capture, signals favorable asymmetry when it is above 1.0. Here the fund gave up some upside in exchange for a proportionally larger cut in downside.
Six months is far too short for a real decision. Use it to practice, then run the same steps on at least three years of monthly data.
How to read the number
The research summary from Morningstar's paper is simple. A ratio of 100% means the investment matched the benchmark. Above 100% in up markets is favorable. Above 100% in down markets is unfavorable. Below 100% on the upside means less participation in rallies, while below 100% on the downside means smaller losses in declines, which is favorable.
| Up capture | Down capture | What it suggests |
|---|---|---|
| Above 100% | Below 100% | The ideal pattern: more of the gains, less of the losses |
| Above 100% | Above 100% | Amplified exposure: bigger gains and bigger losses |
| Below 100% | Below 100% | Defensive profile: smaller gains, smaller losses |
| Below 100% | Above 100% | The weakest pattern: less of the gains, more of the losses |
BlackRock's commentary frames the desirable pattern as capturing more than 100% of market gains and less than 100% of market losses, all else equal. Few funds sustain that for long, which is why the ratio is useful for spotting the ones that come close.
Does the pattern predict anything?
Some evidence says it can help. Researchers Marlo and Stark showed that the difference between up and down capture, a measure they called skill, was positively related to future one-year fund performance. That is a tilt in the odds, not a promise. Use it as one input in your selection process.
Match the pattern to your goal
The right capture profile depends on who you are.
- Long-term accumulators with decades ahead can tolerate high up capture and the high down capture that usually comes with it. Staying invested matters more than avoiding every dip. Our piece on time in the market explains why.
- Retirees drawing income often care most about down capture, because losses early in withdrawals are hard to recover from. A fund with up capture of 80% and down capture of 60% may suit that goal better than one at 105% and 100%.
- Students and beginners can use capture ratios as a practice tool: pull two funds, compute both numbers, and see how the style of each shows up in the data.
If protecting capital is your priority, see our guide to downside protection strategies.
Limits to keep in mind
Capture ratios are a comparison with a benchmark over one evaluated period. The Morningstar paper cautions that upside and downside capture ratios taken individually can be poor descriptions of overall performance, so they should not be used alone. These are the issues that most often distort them.
Benchmark choice
The benchmark must reflect the manager's real area of expertise. Industry consultants stress that the selection of the benchmark is critical for capture ratios to have comparative value. A small-cap value fund measured against a large-cap growth index will produce numbers that say more about the mismatch than about the manager.
Time period
The period you choose matters. One analysis of tactical and equity hedge managers notes that the time period is significant when evaluating them. A window that starts at a market peak will flatter defensive funds, and one that starts at a trough will flatter aggressive ones. Check several windows, such as 3, 5 and 10 years, and see whether the story holds.

Flat markets
When the benchmark barely moves, the denominator in the formula is tiny. Capture ratios can then be unstable and produce extreme values in periods of low volatility or near-zero benchmark returns. Treat a strange reading in a quiet period with suspicion.
Negative downside capture
If a fund gained while the benchmark fell, its downside capture is negative, and the usual interpretation can break down. In that case, look at the up and down results separately instead of dividing one by the other.
Risk is more than direction
Capture ratios say nothing about overall volatility or risk-adjusted return, so they work best next to other measures. The same source recommends pairing them with standard deviation, Sharpe ratio and maximum drawdown.
Pair capture ratios with other measures
Think of capture ratios as a lens on direction and the other metrics as lenses on size and efficiency.
- The Sharpe ratio shows return per unit of total volatility.
- The Sortino ratio counts only downside volatility, which lines up well with what down capture is trying to describe.
- Maximum drawdown shows the deepest peak-to-trough fall, a worst-case figure that averages inside a capture ratio can hide.
- Our overview of risk-adjusted returns shows how to compare these metrics side by side.
Drawdown thinking is not only for long-term investors. Traders working under firm-imposed limits face the same question in a harsher form, and these drawdown rules for funded traders show how a hard loss limit changes the way you weigh gains against losses. If a strategy can capture most of a rally but also breaches a loss limit in a selloff, the capture ratio alone would never warn you.
If you want to see how your own holdings have actually performed rather than a fund's, start with how to track portfolio performance and read about TWR versus MWR, since the return method you choose changes the numbers you feed into any ratio.
A short checklist for using capture ratios
- Identify the right benchmark for the fund's strategy.
- Use at least three years of monthly data, and test a second window.
- Compute or find both up and down capture, using one source for every fund you compare.
- Divide up by down for a quick asymmetry read.
- Check Sharpe, Sortino and maximum drawdown for the same period.
- Ask whether the pattern fits your time horizon and your tolerance for losses.
Perspective
We built Oracle Investments around a simple belief: a number is only useful when you can see where it came from. Capture ratios are a good example. They are rule-based, they come from reported returns, and anyone can check the arithmetic, which is exactly the spirit of the value investors we learn from.
Buffett, Munger and Lynch all returned to the same idea: understand what you own and what could go wrong before you worry about what could go right. Down capture is that idea expressed as a statistic. A fund that holds up in a selloff gives you time, and time is what compounding needs.
That is also why we do not treat any single metric as an answer. Our scores rest on profitability, valuation and financial health, shown with their inputs, so you can compare companies side by side and see for yourself what drives a result. Use capture ratios to judge how a fund behaved, and use fundamentals to judge what you actually own.
Matt
Put fundamentals next to performance statistics
Capture ratios look backward at how a fund moved against an index. If you pick individual stocks, the same discipline applies to the businesses themselves. Oracle Investments scores over 260 stocks on profitability, valuation and financial health, with every scoring input shown, so you can compare companies side by side without building spreadsheets. The app also includes real-time portfolio tracking and educational content drawn from Buffett, Munger and Lynch.

The subscription is sold through the Apple App Store. You can learn more and get started with Oracle Investments Premium Annual.
FAQ
What is a good upside capture ratio?
There is no universal good number. Above 100% means the fund gained more than its benchmark in up months, but that is only attractive if the downside capture stays below 100%. Read the two together, and judge against peers that share the same benchmark.
What is the difference between upside and downside capture ratio?
Upside capture measures how much of the benchmark's gains the fund kept in months when the benchmark rose. Downside capture measures how much of the benchmark's losses the fund took in months when it fell. You want high upside and low downside, but most funds trade one for the other.
Can the upside capture ratio be over 100%?
Yes. A fund that is more aggressive than its benchmark, for example through higher-beta holdings or leverage, can have an upside capture above 100%. It often comes with a downside capture above 100% as well, so check both before drawing a conclusion.
How long a period should I use?
Use at least three years of monthly returns and compare against a five-year window if available. Short or unusual periods can skew the result, and ratios can be distorted when the benchmark barely moves. If the pattern changes a lot between windows, treat the result as less reliable.
Sources
- Capture Ratio as a Tool to Measure Investment Performance
- Up and Down Capture Ratios: Formula, Interpretation, and More
- Upside Capture Ratio, Tamarac data dictionary
- What Matters More: Making Money or Not Losing It?
- Do capture ratios actually tell us anything?
- Upside and Downside Capture Statistics: Caveats and Cautions
- Tactical Topic, June 2017
- Capture Ratio in Mutual Funds: Meaning and Formula
- Downside Capture Ratio: Formula, Meaning, and Uses
- Prop Firm Drawdown Rules Explained for Funded Traders