
What is the Sharpe ratio and why does it matter?
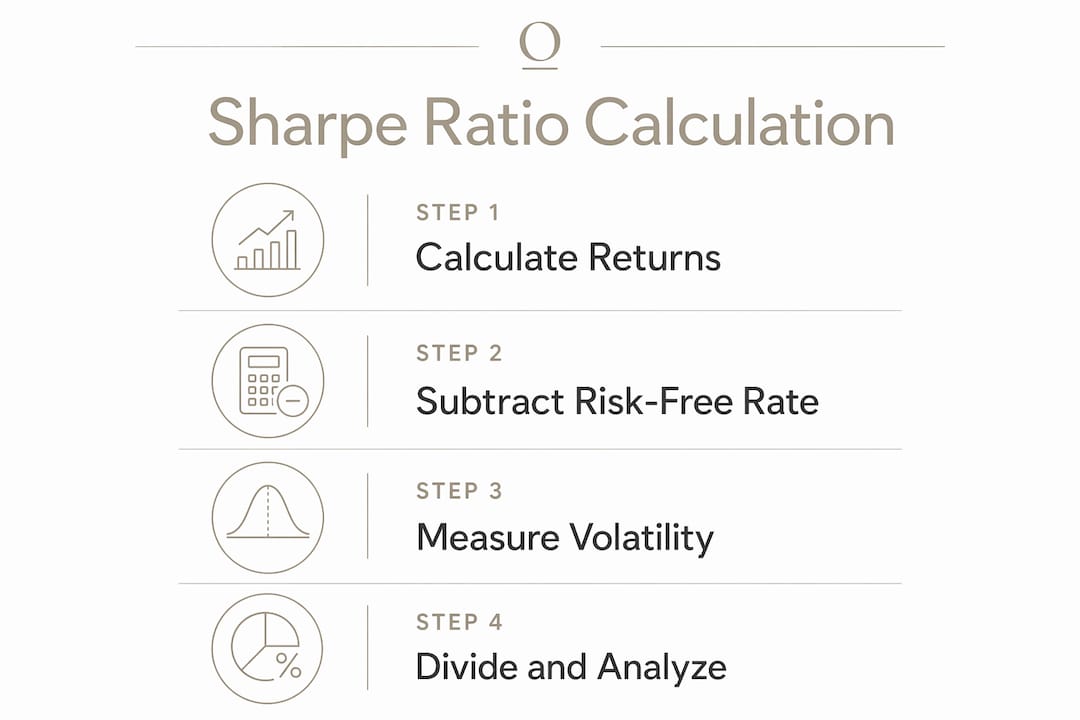
The Sharpe ratio measures how much return you earn for every unit of risk you take. A portfolio returning 12% sounds great until you realize it swings 30% in either direction. The ratio cuts through that noise by comparing excess returns (what you earn above a safe, risk-free asset) to the volatility of those returns. The result is a single number that tells you whether your gains are coming from skill or from simply taking on more risk.
William F. Sharpe, a Nobel Laureate in Economics, developed this metric to answer a deceptively simple question: are a fund manager's returns the product of good decisions, or just a high-risk bet that happened to pay off? That original intent still drives how investors use the ratio today.
Core components at a glance:
- Portfolio return (Rp): The total return generated by your investment over a given period
- Risk-free rate (Rf): The return on a zero-risk asset, typically U.S. Treasury yields
- Standard deviation (σp): The volatility of the portfolio's excess returns
- The ratio itself: A unitless decimal, not a percentage
How to calculate the Sharpe ratio
The Sharpe ratio formula is:
Sharpe Ratio = (Rp − Rf) / σp

Each variable does specific work. Rp is your portfolio's return over the measurement period. Rf is the risk-free rate, most commonly the yield on a 3-month or 10-year U.S. Treasury. σp is the standard deviation of the portfolio's excess returns, which captures how much those returns bounce around.
Step-by-step example:
- Portfolio annual return (Rp): example value
- Risk-free rate (Rf): approximate U.S. Treasury yield
- Standard deviation of excess returns (σp): example value
- Calculation uses those values to illustrate the formula
That result of 0.75 falls below 1.0, which signals the portfolio is not generating enough return to justify its risk level. Swap the numbers slightly: if the same portfolio returned 14% with the same volatility, the ratio climbs to 1.25, landing in the "good" range.
A few practical notes on the calculation:
- Use consistent time periods: monthly returns compared against a monthly risk-free rate, or annual against annual
- Annualizing monthly data requires multiplying the monthly ratio by the square root of 12
- Fewer than 30 data observations make the result statistically unreliable; at least one full year of returns is the practical minimum
Pro Tip: When choosing your risk-free rate, match the duration to your investment horizon. A short-term trader might use the 3-month T-bill rate, while a long-term equity investor typically references the 10-year Treasury yield.
Interpreting the Sharpe ratio: what the values mean
The ratio is a decimal, not a percentage. A reading of 1.5 means you are earning 1.5 units of excess return for every unit of risk, which is a clean way to compare two very different portfolios on equal footing.
Standard interpretation categories:
- Below 1.0: Suboptimal. The return does not adequately compensate for the risk taken.
- 1.0–1.99: Good. A solid risk-return tradeoff for most investors.
- 2.0–2.99: Very good. Consistently strong risk-adjusted performance.
- 3.0 and above: Excellent, though extremely high values can sometimes indicate unusual risk profiles or data issues worth investigating.
A negative ratio means the portfolio has underperformed the risk-free rate entirely. You would have been better off holding Treasury bills. One nuance worth knowing: a negative ratio can be "improved" by increasing volatility, which is obviously not a real improvement. For negative readings, the ratio loses its interpretive usefulness.
How investors use the Sharpe ratio in portfolio analysis

The ratio's real power shows up in comparisons. Two funds might both return 9% annually, but if one does it with half the volatility of the other, its Sharpe ratio will be meaningfully higher. That gap tells you something a raw return figure never could.
Practical applications:
- Fund selection: Compare mutual funds and ETFs on a risk-adjusted basis rather than raw performance
- Portfolio construction: Identify which assets improve the overall ratio when added to a portfolio
- Manager evaluation: Assess whether a fund manager's alpha reflects skill or leverage, as Sharpe originally intended
- Risk tolerance alignment: Investors with lower risk tolerance can use the ratio to screen out high-volatility options even when returns look attractive
- Benchmark comparison: Measure a portfolio against an index to see if active management is adding value on a risk-adjusted basis
The ratio works best when comparing similar asset classes over the same time period. Comparing a bond fund's ratio to an equity fund's ratio without context can lead to misleading conclusions, since bonds structurally carry lower volatility.
Limitations and criticisms of the Sharpe ratio
The ratio has real weaknesses, and ignoring them leads to poor decisions. The most fundamental problem is its assumption that returns follow a normal distribution. Real markets do not behave that way. Extreme events, crashes, and sudden spikes occur far more often than a bell curve predicts, and the ratio underestimates these tail risks as a result.
Key limitations:
- No distinction between up and down volatility: A portfolio that spikes upward and one that crashes downward can produce identical standard deviations, and thus identical ratios
- Fat tails ignored: The normal distribution assumption misses the outsized losses that define real bear markets
- Illiquid assets distort results: Smoothed pricing on private equity or real estate artificially suppresses measured volatility
- Sensitive to the risk-free rate: Changing from a 3-month T-bill to a 10-year Treasury can shift the ratio noticeably
- Short data samples: Fewer than 30 observations produce statistically noisy results
- High ratios can mislead: An investment with a Sharpe of 3.9 can still carry extreme volatility and large potential drawdowns that would devastate a conservative investor
Pro Tip: Never evaluate the Sharpe ratio in isolation. Pair it with the Sortino ratio (which penalizes only downside volatility) and maximum drawdown to get a complete picture of a portfolio's risk profile. You can explore how Oracleinvestments incorporates multiple risk signals in its stock scoring approach.
Practical examples: calculating and comparing two funds
Walking through a side-by-side comparison makes the ratio's value concrete. Assume both funds are evaluated over the same one-year period with a risk-free rate of 4%.
| Metric | Fund A | Fund B |
|---|---|---|
| Annual return | example values | example values |
| Risk-free rate | approximate U.S. Treasury yield | approximate U.S. Treasury yield |
| Excess return | calculated from above values | calculated from above values |
| Standard deviation | example volatility | example volatility |
| Sharpe ratio | calculated result | calculated result |
Fund B looks more attractive on raw return alone. But its Sharpe ratio of 0.875 falls below 1.0, meaning it is not compensating investors adequately for the volatility it carries. Fund A, with a ratio of 1.33, delivers better risk-adjusted performance despite the lower headline number. For a portfolio monitoring framework that incorporates these comparisons regularly, the ratio becomes a reliable screening tool rather than a one-time calculation.
Frequently asked questions about the Sharpe ratio
What is a good Sharpe ratio? A ratio between 1.0 and 1.99 is considered good by financial industry standards. Anything above 2.0 is very good, and above 3.0 is excellent, though very high values warrant scrutiny.
Is a Sharpe ratio of 0.7 good? No. A ratio of 0.7 falls below 1.0, which is the suboptimal threshold. The portfolio is not generating enough excess return relative to its volatility.
What does a Sharpe ratio of 1.5 mean? It means the portfolio earns 1.5 units of excess return for every unit of risk taken. That sits comfortably in the "good" range and reflects a solid risk-return tradeoff.
How does the Sharpe ratio compare to the Sortino ratio? The Sortino ratio is a refinement of the Sharpe ratio. It uses only downside deviation in the denominator rather than total standard deviation, so it does not penalize a portfolio for upward volatility. For investments with asymmetric return profiles, the Sortino ratio gives a more accurate picture. You can read more about complementary risk metrics like the margin of safety in value investing.
What does Warren Buffett's Sharpe ratio illustrate? Berkshire Hathaway has historically maintained a Sharpe ratio that reflects disciplined, concentrated investing rather than diversification for its own sake. The ratio illustrates that consistent, fundamentals-driven returns can produce strong risk-adjusted performance without excessive volatility, which aligns with the original purpose Sharpe had in mind.
The origin and history of the Sharpe ratio
William F. Sharpe introduced the metric in 1966, calling it the reward-to-variability ratio. The name did not stick, but the concept did. Sharpe revised the definition in 1994 to account for time-varying benchmarks, shifting from a fixed risk-free rate to a more flexible benchmark return. That revision is what practitioners use today.
The ratio emerged from a broader effort in the 1960s to bring quantitative rigor to portfolio management. Harry Markowitz had already introduced modern portfolio theory in 1952, and Sharpe's metric gave investors a practical single-number tool to evaluate performance within that framework. Andrew Roy had proposed a conceptually similar ratio in 1952 as well, using a minimum acceptable return in the numerator rather than a risk-free rate. The Sortino ratio, developed later, built directly on that lineage.
Applying the Sharpe ratio across stocks, bonds, and portfolios
The ratio behaves differently depending on the asset class, and treating it as a universal constant leads to mistakes. Bonds typically produce lower Sharpe ratios than equities during bull markets simply because their returns are lower, not because they are poorly managed. Comparing a bond fund's ratio to an S&P 500 index fund without accounting for that structural difference is an apples-to-oranges exercise.
For individual stocks, the ratio can be volatile and misleading over short periods. A single strong quarter can inflate the ratio dramatically, while one bad month can collapse it. Portfolios smooth out that noise through diversification, which is why the ratio is most reliable at the portfolio level rather than for individual securities. Precious metals, for instance, often carry lower standalone ratios but can reduce overall portfolio risk when added to an equity-heavy allocation, improving the portfolio-level ratio even as the asset itself looks modest in isolation.
For practical use, apply the ratio consistently: same time period, same risk-free rate, and enough data points to produce a statistically meaningful result.
Key Takeaways
The Sharpe ratio measures excess return per unit of risk, making it the most widely used single metric for comparing investment performance on a risk-adjusted basis.
| Point | Details |
|---|---|
| Core formula | Sharpe Ratio = (Portfolio Return − Risk-Free Rate) / Standard Deviation of Excess Returns |
| Interpretation thresholds | Below 1.0 is suboptimal; 1.0–1.99 is good; 2.0–2.99 is very good; 3.0+ is excellent |
| Unitless decimal | A ratio of 1.5 means 1.5 units of excess return per unit of risk, not a percentage |
| Key limitation | The ratio assumes normally distributed returns and underestimates tail risks and extreme events |
| Best used alongside | Sortino ratio and maximum drawdown for a complete view of portfolio risk |
Ready to put risk-adjusted thinking to work? Oracleinvestments scores over 260 stocks on profitability, valuation, and financial health, so you can compare investments the way the numbers actually demand. Start analyzing smarter today.
