
Portfolio performance tracking is the systematic process of measuring how your investments grow and manage risk over time. Without it, you are flying blind. You might see a gain in your account balance and assume you are doing well, when in reality inflation, fees, and poor stock selection are quietly eroding your returns. Effective tracking means using industry-standard metrics like Time-Weighted Return (TWR) and the Sharpe ratio to measure investment skill, not just account growth. Oracleinvestments builds these tools directly into its platform, making professional-grade analysis accessible to individual investors at every level.
How to track portfolio performance: the data you need first
Accurate portfolio performance tracking starts with complete transaction data. Every transaction record must include the ticker symbol, purchase date, share count, price paid, and all associated fees. Missing even one of these fields corrupts your return calculations downstream. Think of this data foundation as the raw material for every metric you will ever calculate.
Most investors underestimate how much data hygiene matters. A spreadsheet with gaps in the fee column will overstate your net returns. An online tracker that pulls live prices but ignores historical dividends gives you an incomplete picture. The tool category you choose matters less than the completeness of the data you feed into it.
Here is what your tracking setup needs to capture:
- Transaction log: date, ticker, shares, price per share, and brokerage commission for every buy and sell
- Dividend records: payment date, amount per share, and whether dividends were reinvested or taken as cash
- Fee ledger: management fees, platform fees, and any currency conversion costs
- Corporate actions: stock splits, mergers, and spin-offs that change your cost basis
- Cash flow dates: exact dates of deposits and withdrawals, which matter for TWR calculations
Pro Tip: Keep a dedicated ledger tab for transaction fees and dividends from day one. Reconstructing this data retroactively is far harder than recording it in real time, and the errors compound quickly.
The tool you use to organize this data can range from a spreadsheet to a desktop app to an online tracker with API-driven live pricing. Automation helps with live price feeds, but manual entry discipline is what separates investors who know their real returns from those who only think they do.
How do you calculate portfolio returns accurately?
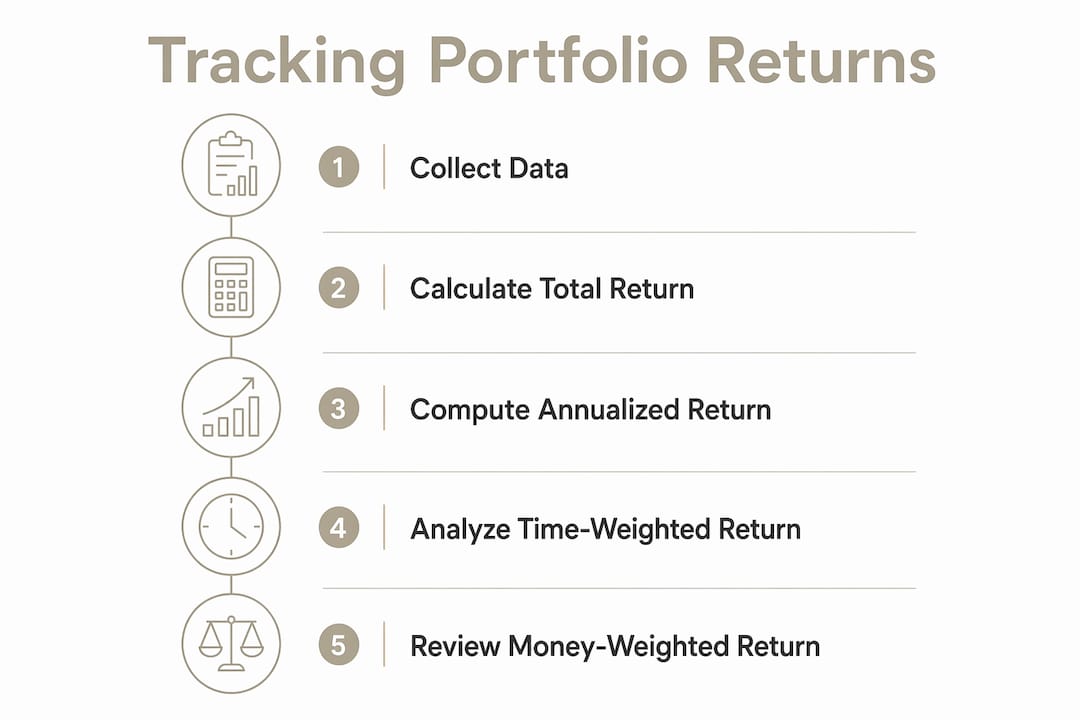
Total return is the starting point. It measures the percentage gain or loss on an investment, including price appreciation and dividends received, relative to the original cost. The formula is straightforward: subtract your starting value from your ending value, add any income received, then divide by the starting value.

Annualized return takes that figure and converts it to a yearly rate, which lets you compare investments held for different time periods. A 40% gain over four years is not the same as a 40% gain over two years. The annualized formula uses the geometric mean, expressed as: [(1 + total return) ^ (1 / years held)] minus 1. This single adjustment makes cross-period comparisons honest.
Time-Weighted Return is the metric professional fund managers use, and individual investors should too. TWR geometrically links sub-period returns, which removes distortions caused by the timing of cash deposits and withdrawals. Without TWR, an investor who added a large sum right before a market rally would show inflated returns that reflect lucky timing, not investment skill.
Here is how to calculate TWR step by step:
- Divide your holding period into sub-periods, with each sub-period ending on the date of a cash flow event (deposit or withdrawal).
- Calculate the return for each sub-period: (ending value before cash flow minus beginning value) divided by beginning value.
- Add 1 to each sub-period return to get a growth factor.
- Multiply all growth factors together.
- Subtract 1 from the result to get your TWR.
For example: if your portfolio returned 5% in sub-period one and 8% in sub-period two, your TWR is (1.05 × 1.08) minus 1, which equals 13.4%.
Money-Weighted Return (MWR), by contrast, does reflect the timing of your cash flows. MWR is useful for understanding your personal financial outcome, but it is not suitable for comparing your skill against a benchmark or another manager. Professional fund managers rely on TWR precisely because it isolates investment decisions from capital timing decisions.
Pro Tip: Calculate both TWR and MWR. If your MWR significantly exceeds your TWR, you timed your contributions well. If TWR beats MWR, your stock selection is strong but your contribution timing has held back your personal dollar returns.
How do you benchmark and interpret portfolio metrics?
A return number means nothing without context. Comparing against a proper benchmark aligned with your asset allocation and market segment is the only way to know whether your results reflect skill or just a rising tide. A portfolio of small-cap value stocks should not be compared against the S&P 500. It should be compared against a small-cap value index.
Once you have the right benchmark, you can calculate alpha, which is the return your portfolio generated above or below what the benchmark produced. Positive alpha signals that your stock selection added value. Negative alpha means the index beat you, and a low-cost index fund would have served you better.
Returns alone provide limited insight into investment quality. Risk metrics complete the picture:
- Volatility (standard deviation): measures how much your returns swing around their average. High volatility means a rougher ride for the same destination.
- Sharpe ratio: divides excess return (above the risk-free rate) by volatility. A Sharpe ratio above 1.0 is generally considered good. A portfolio with a 12% return and low volatility can outrank one with a 15% return and wild swings.
- Beta: measures your portfolio's sensitivity to market movements. A beta of 1.2 means your portfolio moves 20% more than the market in both directions.
- Concentration risk (HHI): the Herfindahl-Hirschman Index measures how concentrated your holdings are. An HHI above 2,500 signals dangerously high concentration. Holding 20–30 stocks is the standard recommendation for effective diversification.
Pro Tip: Match your benchmark's sector exposure to your portfolio's actual composition. A tech-heavy portfolio compared against a broad market index will always look like a genius in a bull market and a disaster in a correction. The comparison tells you nothing useful.
Reading a value rating breakdown alongside these risk metrics gives you a fuller picture of whether a stock's return is justified by its fundamentals or just momentum.
What review routine prevents tracking mistakes?
Quarterly portfolio reviews and annual rebalancing strike the right balance between staying informed and avoiding emotional overreaction. Quarterly reviews let you catch drift in your allocation before it becomes a structural problem. Annual rebalancing is the moment to realign your holdings with your target weights.
Daily monitoring is the enemy of good investing. Checking your portfolio every morning trains your brain to react to noise rather than signal. Short-term price swings carry almost no information about the long-term quality of your holdings.
The most common tracking mistakes individual investors make:
- Ignoring fees: Many investors overestimate profitability by leaving commissions and platform fees out of their return calculations. Net return is the only number that matters.
- Survivorship bias: only tracking positions you still hold ignores the losses from stocks you sold. Your full transaction history, including losers, must stay in the record.
- Wrong benchmark: comparing a bond-heavy portfolio to an equity index makes every year look like underperformance. Match the benchmark to the asset class.
- Confusing return metrics: using total return for one period and annualized return for another makes comparisons meaningless. Pick one methodology and apply it consistently.
"Objective metrics are the antidote to emotional decision-making. When you know your Sharpe ratio and alpha, you have a factual basis for every portfolio decision. Without them, you are just reacting to your account balance."
Maintaining data accuracy requires discipline. Every dividend, every commission, every corporate action needs to be logged at the time it occurs. Retroactive reconstruction introduces errors that quietly distort every metric you calculate afterward. The value investing mistakes beginners make often trace back to incomplete records and inconsistent methodology, not bad stock picks.
Key Takeaways
Effective portfolio performance tracking requires complete transaction data, industry-standard return metrics like TWR, and risk-adjusted benchmarking to separate investment skill from market luck.
| Point | Details |
|---|---|
| Complete transaction data | Record every ticker, date, price, share count, fee, and dividend from the start. |
| Use TWR for benchmarking | Time-Weighted Return removes cash flow distortions and reflects true investment skill. |
| Risk metrics complete the picture | Pair returns with Sharpe ratio, beta, and HHI to assess quality, not just size of gains. |
| Match your benchmark | Compare your portfolio only against an index with the same asset class and sector exposure. |
| Review quarterly, rebalance annually | Rebalance when allocation drifts more than 5% from target to maintain your risk profile. |
Why disciplined tracking changed how I invest
Most investors I talk to think they know their returns. They look at their account balance, compare it to last year, and call it a day. That approach feels like tracking, but it is not. It took me years to realize that my "good years" were often just the market going up, not my stock selection working.
The shift happened when I started calculating TWR and comparing it against a relevant benchmark. Suddenly I could see which positions were actually adding alpha and which were just riding sector momentum. That clarity is uncomfortable at first. You find out that some of your favorite holdings have been a drag on performance for years.
The Sharpe ratio was the second revelation. A portfolio with a 14% return and a Sharpe ratio of 0.6 is objectively worse than one with a 10% return and a Sharpe ratio of 1.2. You are taking on far more risk per unit of return. Once you internalize that, you stop chasing high-return stocks and start asking whether the return justifies the volatility.
The practical challenge for individual investors is consistency. Life gets busy, and the tracking discipline slips. My advice: set a calendar reminder for a quarterly review and treat it like a bill payment. Non-negotiable. The investors who build wealth over decades are not necessarily the ones who pick the best stocks. They are the ones who know exactly what their portfolio is doing and why.
The Oracle Journal covers these concepts in depth, including how to apply value investing principles alongside performance metrics for a more complete analytical framework.
— Matt
Oracleinvestments: portfolio tracking built for individual investors
Tracking your returns, benchmarking against the right index, and calculating risk metrics by hand is possible. It is also time-consuming and error-prone. Oracleinvestments was built to handle that work for you.

The platform scores over 260 stocks on profitability, valuation, and financial health, drawing on the investment frameworks of Warren Buffett, Charlie Munger, and Peter Lynch. Real-time portfolio tracking and instant side-by-side stock comparisons give you the data you need to act on your quarterly reviews with confidence. Whether you are just starting to build a tracking habit or refining an existing system, Oracleinvestments gives you the analytical depth that used to require a professional advisor.
FAQ
What is Time-Weighted Return and why does it matter?
Time-Weighted Return (TWR) measures portfolio performance by removing the effect of cash deposits and withdrawals. It is the professional standard for comparing investment skill against a benchmark because it reflects what the portfolio actually earned, not when money happened to arrive.
How often should I review my portfolio performance?
Quarterly reviews and annual rebalancing are the recommended cadence. Rebalance when any asset class drifts more than 5% from its target weight to keep your risk profile intact.
What is a good Sharpe ratio for a portfolio?
A Sharpe ratio above 1.0 is generally considered strong. A portfolio with a lower return but a higher Sharpe ratio is often the better investment because it delivers more return per unit of risk taken.
Why does benchmark selection matter so much?
Benchmark mismatch can make poor performance look strong or strong performance look weak. A small-cap portfolio compared against the S&P 500 tells you almost nothing useful about your actual investment skill.
What fees should I include when calculating net returns?
Include brokerage commissions, platform fees, management fees, and currency conversion costs. Leaving any of these out overstates your net profitability and gives you a false read on how your portfolio is actually performing.