
The interest coverage ratio (ICR) tells you, in a single number, how many times a company's operating earnings can cover its interest expense. The formula is straightforward: ICR = EBIT ÷ Interest Expense. A common EBITDA-based variant adds depreciation and amortization back to EBIT before dividing, which produces a higher, less conservative figure. As a quick screening rule: a ratio above roughly 2.0x is generally considered acceptable, while anything below 1.5x puts most analysts on alert. Drop below 1.0x and the company cannot cover its interest from operating earnings at all.
Two related metrics often appear alongside ICR in credit analysis: the Debt-Service Coverage Ratio (DSCR), which factors in principal repayments as well as interest, and the Fixed-Charge Coverage Ratio (FCCR), which captures lease obligations and other fixed charges. ICR is the fastest of the three to calculate and the most widely cited in earnings calls and covenant language.
Table of Contents
- What does the interest coverage ratio actually measure?
- Breaking down the components: EBIT, EBITDA, and interest expense
- How to calculate the interest coverage ratio step by step
- A worked example: calculating ICR from an income statement
- How to read ICR results: ranges, red flags, and trend analysis
- Variants and related measures: TIE, EBITDA-based ICR, and FCCR
- Where ICR falls short and which metrics to pair with it
- Practical ways investors, lenders, and analysts use ICR
- How companies can improve their interest coverage ratio
- Key Takeaways
- Why the headline ratio is only half the story
- Oracleinvestments makes tracking coverage ratios faster across your portfolio
- Useful sources and further reading
What does the interest coverage ratio actually measure?
At its core, ICR answers one question: can this company service its debt from what it earns before financing costs and taxes? Lenders, bond investors, and credit analysts use it as a first-pass solvency check. A bank considering a new credit facility will scan ICR before opening the full credit file. A fixed-income investor monitoring a high-yield bond will watch it quarterly.
The ratio matters because it sits at the intersection of two forces: operating performance and capital structure. A company can have strong revenues and still post a dangerous ICR if it has loaded up on debt. Conversely, a modest earner with little debt can carry a ratio that signals genuine financial stability.

Where ICR is most useful is as a trend tool rather than a snapshot. A single quarter's reading tells you where a company stands today. Three years of readings tell you whether management is gaining or losing ground against its interest burden. A steadily declining ICR, even if it stays above 2.0x, is a warning sign that the margin of safety is shrinking.
Pro Tip: When screening a new position, pull at least four trailing quarters of ICR alongside the debt schedule. A ratio that looks fine on an annual basis can mask a deteriorating trend visible only in the quarterly data.
Breaking down the components: EBIT, EBITDA, and interest expense
Understanding what goes into the numerator and denominator is where most calculation errors originate.
EBIT: the standard numerator
EBIT stands for Earnings Before Interest and Taxes. You derive it from the income statement by starting with net income, then adding back income tax expense and interest expense. Alternatively, start with revenue and subtract cost of goods sold and all operating expenses (including depreciation and amortization). The result is the same either way: operating profit before any financing or tax effects.
EBITDA: the alternative numerator
EBITDA adds depreciation and amortization back to EBIT. Because D&A is a non-cash charge, EBITDA is often argued to better approximate the cash available to service debt. That argument holds in asset-heavy industries where D&A is large relative to earnings. The tradeoff is that EBITDA-based coverage always produces a higher ratio than EBIT-based coverage, which can make a company look more comfortable than it actually is.
What counts as interest expense
The denominator should include all interest charges on debt obligations: short-term borrowings, long-term bonds, revolving credit facilities, and, where material, the interest component of finance leases. Some analysts net out interest income earned on cash holdings, which is defensible when a company holds significant liquid assets. The table below shows how the numerator choice shifts the result.
| Component | EBIT-Based ICR | EBITDA-Based ICR |
|---|---|---|
| Numerator | EBIT (after D&A) | EBITDA (before D&A) |
| Conservatism | Higher (more conservative) | Lower (less conservative) |
| Best use case | General credit screening | Asset-heavy industries with large non-cash charges |
| Effect on ratio | Lower numeric output | Higher numeric output |
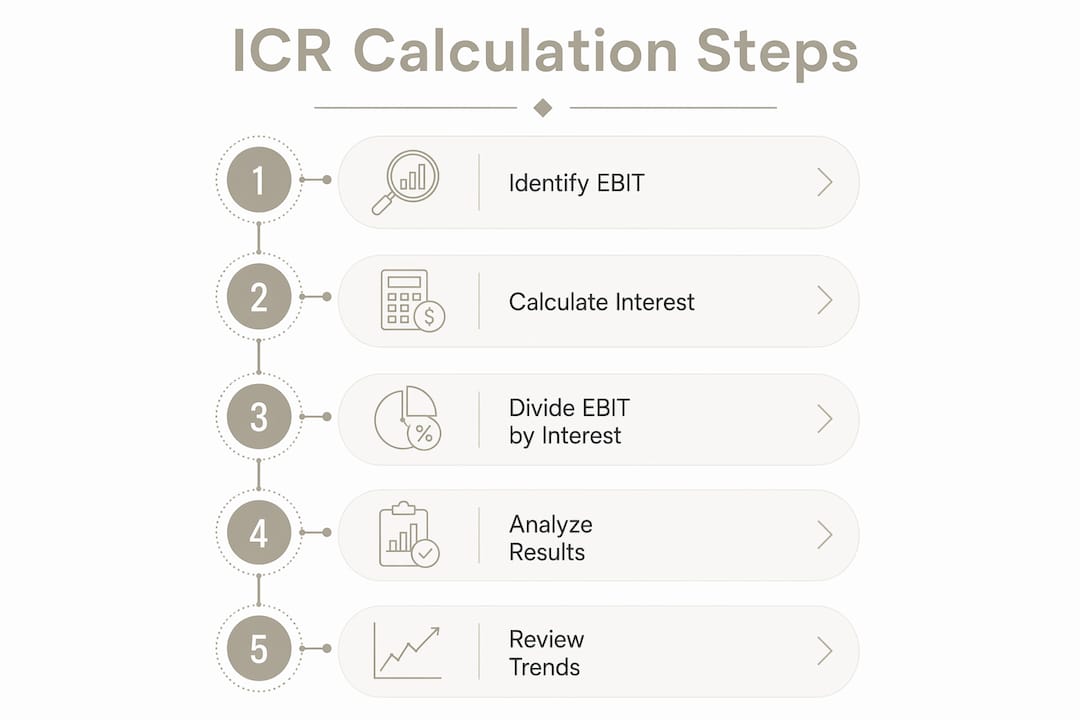
How to calculate the interest coverage ratio step by step
The interest coverage ratio formula is simple; applying it correctly to a real set of financial statements takes a few deliberate steps.
- Pull the income statement for the same period. Use the same fiscal period for both EBIT and interest expense. Mixing a trailing twelve-month EBIT with a single-quarter interest figure is the most common mistake.
- Locate EBIT. Find operating income on the income statement. If the company does not break it out explicitly, compute it as: Revenue minus COGS minus SG&A minus D&A.
- Locate total interest expense. Find the interest expense line, typically below operating income. Check the notes for any capitalized interest or lease-related interest that may not appear on the face of the statement.
- Annualize if necessary. If you are working from a quarterly report, multiply both figures by four before dividing. Partial-period figures produce misleading ratios.
- Divide EBIT by interest expense. The result is the times interest earned ratio.
- Run the EBITDA variant. Add D&A back to EBIT, then divide by the same interest expense figure. Compare the two outputs to understand the sensitivity to the numerator choice.
Common pitfalls to avoid: forgetting to include the interest portion of finance leases (especially post-ASC 842 adoption), using pre-restatement figures, and ignoring one-time charges that inflate or deflate EBIT in a single period. Variable-rate debt is another factor: rising interest rates push interest expense higher even when earnings hold steady, compressing ICR without any operational deterioration.
Pro Tip: Match your period lengths carefully — a trailing twelve-month EBIT divided by a single quarter's interest expense will produce a ratio four times too high.
A worked example: calculating ICR from an income statement
Consider a hypothetical company with the following annual income statement figures:
| Line Item | Amount |
|---|---|
| Depreciation & Amortization | $3,000,000 |
| EBIT (Operating Income) | $11,000,000 |
| Interest Expense | $2,000,000 |
EBIT-based ICR: $11,000,000 ÷ $2,000,000 = 5.5x
EBITDA-based ICR: ($11,000,000 + $3,000,000) ÷ $2,000,000 = $14,000,000 ÷ $2,000,000 = 7.0x
The gap between 5.5x and 7.0x reflects the $3 million D&A add-back. For a capital-light business, that difference is modest. For a manufacturer with $15 million in annual D&A, the same gap would be enormous, which is exactly why analysts in asset-heavy sectors often default to the EBITDA variant while those in financial services or software tend to stick with EBIT. Investopedia's illustrative ICR calculation shows a similar spread, with an example ratio of 6.94x using EBIT.
How to read ICR results: ranges, red flags, and trend analysis
A single number means little without context. Here is how practitioners generally interpret the ranges:
- Below 1.0x: The company cannot cover its interest from operating earnings. This is a critical warning sign; lenders will typically restrict new credit and may accelerate existing covenants.
- 1.0x–1.5x: Technically covering interest, but with almost no margin. A small earnings miss or a rate increase on variable debt could push the ratio below 1.0x.
- 1.5x–2.0x: The zone where many analysts grow cautious. AccountingTools notes that investors may sell when a ratio trends downward toward this range.
- 2.0x–5.0x: Generally considered healthy for most industries. The company has meaningful cushion, and lenders are unlikely to flag it as a credit concern.
- Above 5.0x: Strong coverage. Either the company has low debt, high earnings, or both. Worth checking whether the company is underleveraged relative to peers.
Pro Tip: Never evaluate ICR in isolation from the industry. Utilities and real estate investment trusts routinely operate with ratios in the 1.5x–3.0x range because their cash flows are predictable and regulated. A tech company at 2.0x would raise more concern.
Trend analysis often matters more than any single reading. A company that posts 6.0x, then 4.5x, then 3.2x over three years is telling a story even if it never crosses a threshold. The direction signals that operating earnings are growing more slowly than interest costs, which can reflect rising debt loads, margin compression, or both.

Variants and related measures: TIE, EBITDA-based ICR, and FCCR
The term "times interest earned" (TIE) is simply another name for the standard EBIT-based ICR. The two are interchangeable; the naming difference is mostly a matter of which textbook or practitioner community you learned from.
Beyond TIE, four main variants appear in professional analysis:
EBIT ÷ Interest Expense is the baseline. It is the most conservative of the earnings-based measures because it includes the full drag of depreciation and amortization.
EBITDA ÷ Interest Expense adds non-cash charges back, producing a higher ratio. Analysts favor this in industries where D&A is large and genuinely non-cash, such as cable, telecom, or manufacturing. The risk is that it ignores the eventual capital expenditure needed to replace depreciating assets.
(EBITDA – Capex) ÷ Interest Expense is the most conservative EBITDA-based variant. By subtracting maintenance capital expenditures, it approximates the cash actually available for debt service after keeping the business running. Wall Street Prep notes that this variant tends to output the lowest coverage figures among the EBITDA family, making it the preferred choice when analysts want a conservative stress test.
Fixed-Charge Coverage Ratio (FCCR) expands the denominator to include lease payments and sometimes preferred dividends alongside interest. It is the broadest measure and the one most commonly embedded in bank loan covenants for companies with significant operating lease obligations.
Where ICR falls short and which metrics to pair with it
ICR has a structural blind spot: it measures only interest, not total debt service. A company could post a 4.0x ICR while facing a $200 million principal maturity in 18 months. The ratio would look fine right up until the refinancing fails.
The Debt-Service Coverage Ratio closes that gap by including principal repayments in the denominator: DSCR = Net Operating Income ÷ (Interest + Principal). Commercial real estate lenders commonly require a minimum DSCR of 1.25x; a DSCR below 1.0x means the property's income cannot cover total debt service. ICR and DSCR together give a much fuller picture than either alone.
Other limitations worth knowing:
- ICR is based on accounting earnings, not cash flow. A company can post positive EBIT while generating negative operating cash flow if working capital is consuming cash.
- Non-recurring items (asset sales, restructuring charges, litigation settlements) can distort a single period's EBIT dramatically. Always check whether the EBIT figure is clean or includes one-time items.
- Variable-rate debt means interest expense can rise without any management action, compressing ICR even when operations are stable.
Pro Tip: Build a three-metric check: ICR for interest coverage, DSCR for total debt service, and operating cash flow to interest expense for cash-based validation. If all three point the same direction, you have a reliable signal.
Analysts pair ICR with leverage ratios (net debt to EBITDA is the most common) and operating cash flow metrics to confirm that earnings are actually converting to cash. A high ICR alongside deteriorating cash conversion is a yellow flag, not a green light.
Practical ways investors, lenders, and analysts use ICR
ICR shows up in several distinct workflows across the investment and lending process:
- Credit screening: Analysts filter a universe of bonds or loans by ICR to eliminate the weakest credits before deeper due diligence. A floor of 2.0x is a common starting screen for investment-grade candidates.
- Covenant monitoring: Many syndicated loan agreements include a minimum ICR covenant, often tested quarterly. A breach triggers a technical default even if the company is current on payments.
- M&A due diligence: Acquirers check ICR on a target to understand how much additional debt the combined entity can carry post-transaction.
- Fixed-income credit watch: Bond analysts track ICR quarterly alongside spread movements to anticipate rating agency actions before they happen.
When you encounter a problematic ratio, the right questions are: Is the interest expense fixed or variable? Are principal payments due within 12 months? Does the EBIT figure include one-time gains that inflate the current period? Is the trend improving or worsening? Those four questions will tell you more than the ratio itself.
How companies can improve their interest coverage ratio
Management has two levers: grow the numerator or shrink the denominator.
On the earnings side, the most durable improvements come from operating margin expansion, whether through pricing power, cost discipline, or revenue mix shifts toward higher-margin products. Growing revenue without proportional cost growth raises EBIT directly. These changes take time but they stick.
On the capital structure side, refinancing high-coupon debt at lower rates reduces interest expense immediately. Extending maturities does not lower the ratio directly, but it reduces near-term refinancing risk and can lower the blended cost of debt over time. Companies with excess cash can also pay down principal, which reduces the debt base and future interest charges simultaneously.
Short-term tactics like asset sales or temporary cost cuts can boost a single period's ICR, but lenders and analysts see through them quickly. A one-time asset sale raises EBIT in the period it closes, then disappears. If the underlying business has not improved, the ratio will revert. Sustainable improvement requires either a better business or a lighter debt load, and usually both.
Key Takeaways
The interest coverage ratio is most reliable when tracked as a trend across multiple periods and paired with DSCR and cash-flow measures, not read as a standalone snapshot.
| Point | Details |
|---|---|
| Core formula | ICR = EBIT ÷ Interest Expense; the EBITDA variant adds D&A back and produces a higher, less conservative figure. |
| Screening threshold | A ratio above roughly 2.0x is generally considered acceptable; anything below 1.5x puts most analysts on alert. |
| Trend over snapshot | A declining ICR, even above a moderate threshold, signals eroding margin of safety and warrants closer review. |
| Pair with DSCR | ICR ignores principal repayments; DSCR (minimum levels commonly required in many lending contexts) gives a fuller picture of total debt-service capacity. |
| Oracleinvestments | The app scores over 260 stocks on financial health fundamentals, including coverage metrics, making trend monitoring faster across a portfolio. |
Why the headline ratio is only half the story
Most analysts learn ICR early and use it forever. The problem is that it gets treated as a verdict when it is really just an opening question. A 3.0x ratio on a company with $500 million in floating-rate debt maturing in two years is not the same as a 3.0x ratio on a company with fixed-rate bonds due in a decade. The number is identical; the risk profile is completely different.
What the ratio cannot tell you is whether the earnings behind it are real and repeatable. A company that sells a division to boost EBIT in one quarter will post a beautiful ICR that collapses the moment the sale closes. Analysts who read only the ratio miss that entirely. The ones who catch it are reading the cash flow statement and the notes, not just the headline figure.
There is also an industry-context problem that gets underweighted. Comparing a utility's ICR to a software company's ICR is almost meaningless. The utility operates with regulated, predictable cash flows and can sustain a 2.0x ratio indefinitely. The software company, with lumpy revenue and no hard assets, probably needs 5.0x or more to carry the same level of confidence. Industry benchmarking is not optional; it is the only way the number means anything.
The practical takeaway: use ICR as a filter, not a conclusion. It narrows the field. Then you do the actual work.
Oracleinvestments makes tracking coverage ratios faster across your portfolio
Calculating ICR once for a single company is straightforward. Doing it consistently across 20 or 30 holdings, every quarter, while also tracking trends and flagging covenant-level deterioration, is where most individual investors fall behind.

Oracleinvestments scores over 260 stocks on key financial health fundamentals, including the coverage and leverage metrics this article covers, so you can see where each holding stands without rebuilding spreadsheets every earnings season. The app's side-by-side comparison lets you benchmark ICR across similar companies in seconds, and its value rating system surfaces the stocks where financial health is improving or deteriorating before those shifts show up in price. For investors who want to apply the kind of trend-based ICR analysis described here without the manual work, it is a practical next step. Start screening stocks on Oracleinvestments today.
This article is general financial information, not professional investment or credit advice. Confirm current figures and ratios with primary sources or a qualified financial professional for your specific situation.
Useful sources and further reading
The following sources were used in this article and are worth bookmarking for deeper study:
- AccountingTools — Interest Coverage Ratio: Clear definition, the standard formula, and the 1.5x threshold discussion. Good starting point for the basics.
- Investopedia — Interest Coverage Ratio: Covers the TIE naming convention, worked calculation examples (including a 6.94x illustrative result), and the effect of rising interest rates on the ratio.
- Wall Street Prep — Interest Coverage Ratio: The most detailed practitioner-level treatment of formula variants (EBIT, EBITDA, EBITDA–Capex, FCCR) and when to use each.
- Bill.com Learning — What Is Interest Coverage Ratio?: Practical guidance on period matching, annualizing partial-period data, and netting interest income.
- Wikipedia — Debt-Service Coverage Ratio: Explains how DSCR differs from ICR, the 1.25x lender floor common in commercial real estate, and why lenders often prefer DSCR for total debt-service assessment.
A note on company-published ratios: methods vary. Some companies report ICR using adjusted EBITDA figures that exclude stock-based compensation, restructuring charges, or other items. Always check the footnotes to understand what is actually in the numerator before comparing ratios across companies.