
Risk-adjusted return measures how much return an investment delivers per unit of risk, not just the raw number at the top of a fund fact sheet. Before reading further, check these three ratios first:
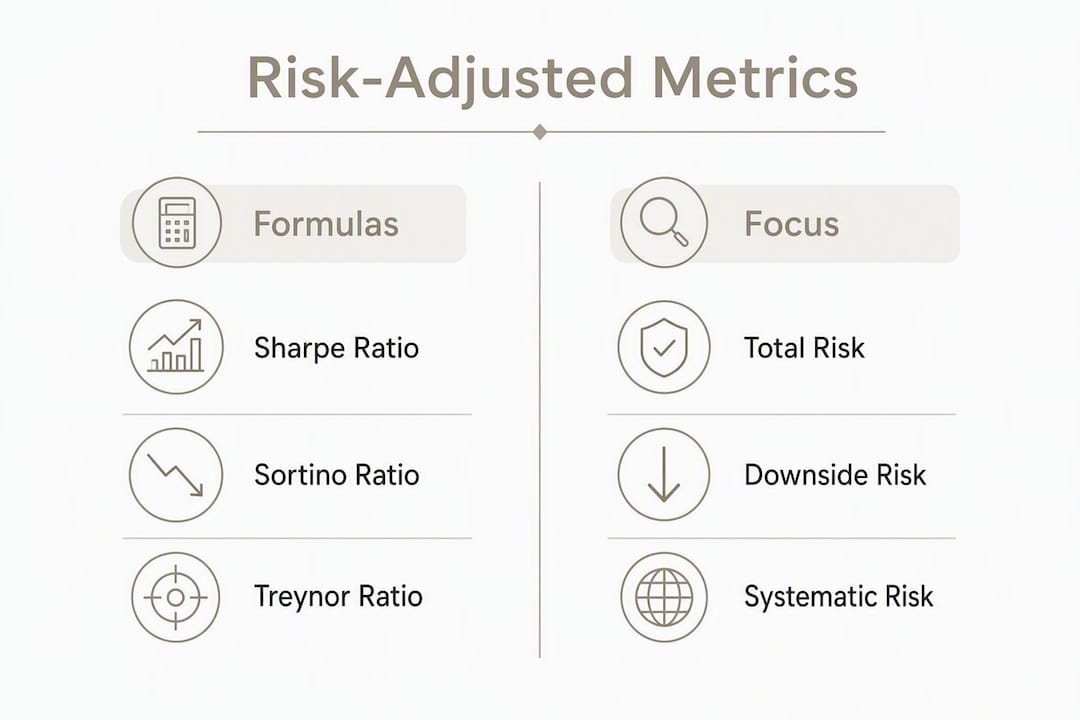
- Sharpe ratio — return above the risk-free rate divided by total volatility (standard deviation). The broadest, most widely used starting point.
- Sortino ratio — same numerator, but divides by downside deviation only. Better when your strategy has an asymmetric return profile.
- Treynor ratio — excess return divided by beta. Use this when you want to isolate exposure to systematic, market-wide risk.
The CFA Institute treats these three as the foundation of performance measurement. For the risk-free rate input, the current U.S. Treasury yield (typically the 3-month T-bill) is the standard proxy. Oracleinvestments automates all three calculations inside its portfolio dashboard, so you can move from raw returns to interpreted ratios in seconds.
Table of Contents
- What does "risk-adjusted return" actually mean?
- Why do investors rely on risk-adjusted metrics?
- Core metrics: formulas, inputs, and quick pros and cons
- How to calculate Sharpe and Sortino: a worked example
- How to interpret ratios and avoid common pitfalls
- Which metric should you use?
- Applying risk-adjusted metrics to portfolio construction and rebalancing
- How Oracleinvestments applies risk-adjusted analysis
- Key Takeaways
- The metric is a tool, not a verdict
- Oracleinvestments puts these calculations in your hands
What does "risk-adjusted return" actually mean?
A nominal return tells you what you earned. A risk-adjusted return tells you what you earned relative to what you risked to earn it. Two funds both returning 12% look identical on a fact sheet. If one achieved that with half the volatility, it delivered a materially better outcome for the same investor.
The definition shifts depending on how you define "risk":
- Standard deviation (total volatility): captures all return variation, up and down. Used by the Sharpe ratio.
- Downside deviation: counts only returns that fall below a target threshold, ignoring upside swings. Used by the Sortino ratio.
- Beta (systematic risk): measures how much of a portfolio's movement is explained by the broad market. Used by the Treynor ratio and Jensen's alpha.
- Value-at-risk and tail risk: estimate potential loss at a given confidence level. Useful for stress-testing but not embedded in the standard ratios.
The risk-free rate anchors the numerator of most metrics. It represents the return you could earn with zero risk, so any excess above it is the compensation for taking on uncertainty. Treasury yields change over the rate cycle, and using a static rate for long-term comparisons can bias your Sharpe and Sortino results. Match the rate to your measurement period: a 3-month T-bill for short-horizon analysis, a longer-duration Treasury for multi-year comparisons.
"Risk-adjusted analysis is as much about aligning volatility with investor risk tolerance and time horizon as it is about maximizing numeric ratios." — BlackRock
Why do investors rely on risk-adjusted metrics?
The short answer: nominal returns lie. A manager who returned 18% last year by concentrating in a single sector took on risks that a diversified 12% portfolio never touched. Without adjusting for risk, you cannot compare them fairly.
Practitioners use these metrics for three core decisions:
- Manager selection: rank candidates not by headline return but by return per unit of risk, then investigate the top performers further.
- Portfolio construction: combine assets whose risk-adjusted contributions improve the overall ratio, not just add raw return. Diversification and correlation between asset classes materially affect portfolio volatility and therefore risk-adjusted outcomes.
- Performance attribution: separate skill from luck by asking whether a manager's alpha persists after adjusting for the risk they took.
There is also a behavioral dimension. Experienced practitioners emphasize risk-aligned portfolios that reduce emotional trading and sequence-of-returns risk. When you anchor decisions to a ratio rather than a raw return, you are less likely to chase last year's winner into an overvalued, high-volatility position.
Diversified portfolios combining equities and fixed income can produce similar long-term returns with lower volatility than all-equity portfolios. That is the diversification benefit expressed as a risk-adjusted outcome: same destination, smoother ride, and a higher ratio.
Core metrics: formulas, inputs, and quick pros and cons
Several common methods measure risk-adjusted returns, each suited to a different question. Here are the five you will encounter most often.
Sharpe ratio
Formula: (Rp − Rf) / σp
Rp = portfolio return, Rf = risk-free rate, σp = standard deviation of portfolio returns. Higher is better. A ratio above 1.0 is generally considered acceptable; above 2.0 is strong for most strategies.
Pros: simple, universally understood, easy to compute in Excel. Cons: penalizes upside volatility equally with downside, assumes normally distributed returns.
For a deeper walkthrough, the Sharpe ratio explained guide covers interpretation across asset classes.
Sortino ratio
Formula: (Rp − Rf) / σd
σd = downside deviation (standard deviation of returns below the target/threshold). Everything else is the same as Sharpe.
Pros: rewards strategies with positive skew; more appropriate for income-oriented or downside-sensitive portfolios. Cons: requires a defined target return; less intuitive for general audiences.
Treynor ratio and Jensen's alpha
Treynor: (Rp − Rf) / βp — excess return per unit of systematic risk (beta).
Jensen's alpha: αp = Rp − [Rf + βp(Rm − Rf)] — the return above what CAPM predicts given the portfolio's beta.
Both isolate return related to market risk and rely on CAPM/beta assumptions. That is their strength and their limit: if the benchmark is wrong or beta is unstable, the output misleads.
Information ratio
Formula: (Rp − Rb) / TE
Rb = benchmark return, TE = tracking error (standard deviation of active return). Measures manager skill relative to a benchmark. A ratio above 0.5 is considered good; above 1.0 is exceptional.
| Metric | Formula / Inputs | Risk type | Best for | Interpretation | Key limitation |
|---|---|---|---|---|---|
| Sharpe | (Rp−Rf) / σp | Total volatility | Overall portfolio evaluation | Higher = better | Penalizes upside vol |
| Sortino | (Rp−Rf) / σd | Downside deviation | Downside-sensitive strategies | Higher = better | Needs target return |
| Treynor | (Rp−Rf) / β | Systematic (market) | Comparing diversified funds | Higher = better | Requires stable beta |
| Jensen's alpha | Rp − CAPM expected | Systematic (market) | Manager skill vs market | Positive = outperformance | CAPM assumptions |
| Information ratio | (Rp−Rb) / TE | Active risk | Active manager benchmarking | Higher = more skill | Benchmark sensitivity |
Pro Tip: Never use Treynor or Jensen's alpha to compare a concentrated portfolio against a diversified one. Beta becomes unreliable when idiosyncratic risk dominates, and the comparison will flatter the concentrated strategy unfairly.
How to calculate Sharpe and Sortino: a worked example
Start with clean inputs. Monthly returns work well for most retail and institutional portfolios; daily returns amplify noise and can inflate volatility estimates.
Step 1: Gather your return series and the risk-free rate.
Use the 3-month U.S. T-bill rate for the matching period. Convert annual rates to monthly: divide by 12.
Step 2: Compute mean excess return.
Subtract the monthly risk-free rate from each monthly portfolio return, then average those differences.
Step 3: Compute standard deviation (for Sharpe) or downside deviation (for Sortino).
For downside deviation, only include months where the return fell below your target (often 0% or the risk-free rate). Square those shortfalls, average them, then take the square root.
Step 4: Divide and annualize.
Multiply the monthly ratio by √12 to express it on an annual basis.
Sample data (6-month illustration):
| Month | Portfolio Return | Risk-Free Rate (monthly) | Excess Return | Below Target? |
|---|---|---|---|---|
| Jan | — | — | — | No |
| Feb | −1.5% | — | — | Yes |
| Mar | — | — | — | No |
| Apr | — | — | — | Yes |
| May | — | — | — | No |
| Jun | — | — | — | No |
Mean excess return: calculate the average of monthly excess returns.
Standard deviation of excess returns: calculate standard deviation of those excess returns.
Monthly Sharpe: divide mean excess return by the standard deviation, then annualize.
Downside deviation: calculate using only months with negative excess returns, then annualize similarly.
Monthly Sortino: divide mean excess return by downside deviation, then annualize.
These steps illustrate how Sharpe and Sortino ratios differ by using total volatility versus downside risk respectively.
The Sortino is nearly double the Sharpe here because most of the volatility was upside. That gap is the signal: this portfolio's downside risk is lower than its total volatility implies.
For replication in code, Python's pandas library handles the entire calculation in under 20 lines. In R, the PerformanceAnalytics package includes SharpeRatio() and SortinoRatio() functions that accept a return series directly. Excel users can build the same table above and use STDEV for standard deviation, with a manual downside-deviation column.
How to interpret ratios and avoid common pitfalls
A Sharpe ratio above a certain moderate threshold is a reasonable baseline for a diversified equity portfolio. Conservative fixed-income strategies generally produce lower ratios appropriate to their mandate, while hedge funds targeting absolute return aim for higher ratios. No single threshold applies universally.
Key limitations to keep in mind:
- Look-back sensitivity: Metrics are highly sensitive to the look-back period. A strategy can look excellent over 3 years and mediocre over 10. Always run rolling windows (3-year, 5-year, full-cycle) before drawing conclusions.
- Non-normal returns: Sharpe, Sortino, and Treynor all assume near-normal return distributions. Fat tails and skewness mean these metrics can understate the chance of severe losses. Pair them with scenario analysis or stress tests.
- Survivorship bias: databases that exclude failed funds inflate average ratios. When benchmarking against a peer group, confirm the dataset includes defunct funds.
- Sample size: fewer than 36 monthly observations makes statistical inference unreliable. Confidence intervals widen fast with small samples.
- Benchmark choice: Jensen's alpha and the Information ratio are only as meaningful as the benchmark is appropriate. A small-cap manager benchmarked against the S&P 500 will show misleading alpha.
Pro Tip: Before trusting any ratio, run it across at least three non-overlapping periods. If the metric is stable across regimes (bull, bear, sideways), it reflects genuine strategy characteristics. If it swings wildly, you are likely measuring luck or a structural shift in the portfolio.
Which metric should you use?
Ask four questions before picking a metric:
- Am I evaluating total portfolio risk or only market-driven risk?
- Does my investor (or am I) particularly sensitive to downside losses?
- Is there a benchmark I am trying to beat, or is this an absolute-return mandate?
- Am I assessing a manager's skill or a strategy's standalone efficiency?
Mapping goals to metrics:
- Long-term diversified portfolio (retirement, endowment): start with Sharpe. It captures total volatility and is the most comparable across asset classes.
- Income-oriented or capital-preservation mandate: use Sortino. Upside swings are not the concern; protecting against drawdowns is.
- Evaluating market timing or factor exposure: Treynor and Jensen's alpha isolate how much of the return came from systematic market exposure versus skill.
- Active manager due diligence: Information ratio is the right tool. It directly measures whether the manager's active bets are generating consistent excess return relative to tracking error.
Two quick examples. A 65-year-old retiree comparing two bond funds should use Sortino: sequence-of-returns risk matters far more than upside variance. A pension fund evaluating three large-cap equity managers against the Russell 1000 should use the Information ratio alongside Jensen's alpha to separate benchmark-driven return from genuine active contribution.
Applying risk-adjusted metrics to portfolio construction and rebalancing
Ratios are not just evaluation tools. They are inputs to portfolio construction decisions.
When building a shortlist of funds, rank candidates by Sharpe (or Sortino for downside-sensitive mandates), then filter for minimum track record length and consistent rolling-period performance. A fund with a 1.8 Sharpe over 5 years but a 0.4 Sharpe over 10 years deserves scrutiny, not a buy.

For portfolio rebalancing strategies, risk-adjusted metrics add a layer beyond simple drift thresholds. If a position's contribution to portfolio Sharpe has declined materially over a rolling 12-month window, that is a signal to review allocation even if the weight drift is within tolerance. Combining a 5% drift rule with a rolling-Sharpe trigger catches regime changes that pure weight-based rebalancing misses.
Diversification strategies work precisely because low-correlation assets reduce portfolio standard deviation without proportionally reducing expected return. That is the mechanism behind the diversification benefit: the denominator of your Sharpe ratio shrinks while the numerator holds, pushing the ratio higher.
For manager evaluation, never rely on a single metric. Combine the Information ratio with a qualitative review of the manager's process, benchmark appropriateness, and fee structure. A manager with a 0.8 Information ratio charging 1.5% in fees may deliver less net value than a 0.6-ratio manager at 0.3%.
How Oracleinvestments applies risk-adjusted analysis
Oracleinvestments pulls return data for its scored universe of over 260 stocks and computes Sharpe, Sortino, and Treynor ratios at both the individual position and portfolio level. The risk-free rate input defaults to the current 3-month U.S. T-bill yield and updates automatically, so your ratios stay current without manual adjustments.
Key outputs the app surfaces:
- Rolling Sharpe and Sortino charts across 1-year, 3-year, and 5-year windows, so you can spot regime sensitivity at a glance.
- Side-by-side metric comparison for any two positions or funds in your portfolio, using the same inputs and time period for a clean apples-to-apples read.
- Portfolio-level analytics that show how each holding contributes to overall risk-adjusted performance, not just its standalone return.
The app sources return data from institutional-grade market feeds, which matters for calculation accuracy. Garbage inputs produce garbage ratios; the quality of the underlying price series directly affects every metric you compute.
Pro Tip: Use Oracleinvestments's rolling-metric view before any rebalancing decision. A single-period Sharpe can look fine while the rolling chart shows a clear downtrend. The trend is often more informative than the point estimate.
For a quick orientation to how the app presents fundamental scores alongside risk metrics, the value rating guide walks through the interface in under a minute.
Key Takeaways
Risk-adjusted return is the only honest way to compare investments: higher ratios mean more return per unit of risk, and the right metric depends on what kind of risk matters most for your mandate.
| Point | Details |
|---|---|
| Start with Sharpe | Use Sharpe for overall portfolio evaluation; it captures total volatility and is comparable across asset classes. |
| Switch to Sortino for downside focus | When protecting against losses matters more than upside variance, Sortino gives a cleaner signal. |
| Watch the look-back window | Ratios can shift dramatically between 3-year and 10-year windows; always run rolling periods before concluding. |
| Match the risk-free rate to your horizon | Using a static rate for long-term comparisons biases results; update the proxy to match your measurement period. |
| Use Oracleinvestments to automate | Oracleinvestments computes rolling Sharpe, Sortino, and Treynor across 260+ stocks with live risk-free rate inputs. |
The metric is a tool, not a verdict
Most investors who discover risk-adjusted metrics make the same mistake: they treat the ratio as the final answer. A Sharpe of 1.8 becomes a green light; a Sharpe of 0.6 becomes a rejection. That is the wrong frame.
Ratios are diagnostic tools. They tell you where to look, not what to do. A strategy with a temporarily depressed Sharpe during a rising-rate environment is not broken. A strategy with a persistently high Sharpe that has never been tested through a credit crisis may be hiding tail risk the metric cannot see.
The behavioral trap is the more dangerous one. When a portfolio's Sharpe drops sharply over a 6-month window, the instinct is to act. Sell the underperformer, rotate into whatever has a better recent ratio. That is return-chasing dressed up in math. The sequence-of-returns risk literature is full of cases where investors locked in losses by reacting to short-term metric deterioration in strategies that recovered fully within two years.
The discipline is to set your interpretation rules before you look at the numbers. Decide in advance: what Sharpe threshold triggers a review? Over what rolling window? Against what benchmark? Then hold to those rules when markets get uncomfortable. The investors who use risk-adjusted metrics well are not the ones who know the most formulas. They are the ones who do not let a bad quarter override a sound process.
Oracleinvestments puts these calculations in your hands
Calculating Sharpe, Sortino, and Treynor manually is instructive the first time. After that, it is friction standing between you and better decisions. Oracleinvestments automates every metric covered in this guide, applying live risk-free rate data and institutional-grade return series to your actual portfolio holdings.

The app scores over 260 stocks on profitability, valuation, and financial health, then layers risk-adjusted metrics on top so you can see not just what a stock has returned, but how efficiently it delivered that return. Rolling charts, side-by-side comparisons, and portfolio-level Sharpe and Sortino outputs are all available without a single spreadsheet.
Start analyzing your portfolio with Oracleinvestments and see which positions are actually earning their risk budget.
Useful sources and further reading
External authority sources:
- Measures of Risk-Adjusted Return — CFA Institute
- Risk-Adjusted Return — Investopedia
- Risk-Adjusted Return — Wall Street Prep
- Beginners' Guide to Asset Allocation, Diversification, and Rebalancing — Investor.gov
Oracle Investments blog resources:
- The Sharpe Ratio Explained for Everyday Investors
- How to Track Portfolio Performance Like a Pro
- Portfolio Drift: How to Spot It and Fix It Fast
- Sequence of Returns Risk: What Stock Investors Must Know
- Best Portfolio Analysis Tools for Investors in 2026
Check original sources for full methodology and data, particularly the CFA Institute document for GIPS-compliant performance measurement standards.