
Oracleinvestments is the recommended pick for most individual investors who want fast, fundamental-driven stock comparisons without spending hours on spreadsheets. Its stock scoring system ranks companies on profitability, valuation, and financial health in seconds, making it the clearest starting point for anyone building or auditing a portfolio.
Here is the short list for readers who want to move fast:
- Oracleinvestments — Best for fundamental scoring and portfolio health checks. iOS app with a paid subscription; real-time portfolio tracking and side-by-side stock comparisons built around Warren Buffett-style fundamentals.
- TradingView — Best for charting and technical analysis. Web, iOS, and Android; free tier available, paid plans from roughly $14.95/month; real-time data on paid tiers.
- Yahoo Finance — Best free option for news and basic portfolio tracking. Web, iOS, and Android; free with optional Yahoo Finance Plus upgrade; delayed data on the free tier.
- Koyfin — Best for macro and multi-asset dashboards. Web-first; free tier available, paid plans from roughly $19/month; strong global data coverage.
- Finviz — Best for fast stock screening. Web-based; free tier with delayed data, Finviz Elite from $24.96/month with real-time data.
- TipRanks — Best for analyst ratings and insider tracking. Web, iOS, and Android; free tier available, premium plans from roughly $29.95/month.
- Thinkorswim — Best for options and advanced trading tools. Web, iOS, Android, and desktop; free with a TD Ameritrade/Schwab account; real-time data included.
Pro Tip: Before committing to any paid plan, run the free tier for two weeks and test the one feature you will use daily. If it is a screener, build your actual filter set. If it is charting, draw on a live chart. Free trials reveal friction that marketing pages never mention.
Table of Contents
- What are the best stock analysis apps right now?
- Individual reviews: which app actually fits your workflow?
- What core features should a stock analysis app have?
- How do stock analysis app pricing tiers compare?
- How do you pick the right stock analysis app for your style?
- Why Oracleinvestments stands out: methodology and honest limits
- Key Takeaways
- What most investors get wrong about choosing a stock app
- Oracleinvestments: score your portfolio in 60 seconds
- Sources and further reading
What are the best stock analysis apps right now?
| App | Best For | Price / Free Tier | Standout Features | Data Latency | Platform | Integrations | Ease of Use |
|---|---|---|---|---|---|---|---|
| Oracleinvestments | Fundamental scoring and portfolio health | Paid subscription (App Store) | 260+ stock scores, side-by-side comparisons, value investing principles | Real-time portfolio tracking | iOS | Portfolio sync | Beginner-friendly |
| TradingView | Charting and technical analysis | Free tier; paid from ~$14.95/mo | Advanced charts, Pine Script, community ideas | Real-time (paid); delayed (free) | Web, iOS, Android | Brokerage integrations | Moderate learning curve |
| Yahoo Finance | News and basic portfolio tracking | Free; Yahoo Finance Plus optional | Editorial coverage, portfolio sync, interactive charts | Delayed (free); near real-time (Plus) | Web, iOS, Android | Multi-brokerage sync | Very easy |
| Koyfin | Macro and multi-asset dashboards | Free tier; paid from ~$19/mo | High-density dashboards, sector analytics, macro data | Real-time (paid) | Web | Portfolio import | Moderate |
| Seeking Alpha | Idea-driven research and quant signals | Free tier; Premium from ~$19.99/mo | Contributor analysis, quant ratings, earnings alerts | Delayed (free) | Web, iOS, Android | Portfolio tracking | Easy to moderate |
| Simply Wall St. | Visual fundamental reports | Free tier; paid from ~$10/mo | Snowflake visual scores, company narratives | Delayed | Web, iOS, Android | Portfolio sync | Very easy |
| TipRanks | Analyst ratings and insider activity | Free tier; Premium from ~$29.95/mo | Smart Score, analyst track records, insider transactions | Delayed (free); real-time (paid) | Web, iOS, Android | Portfolio tracking | Easy |
| Finviz | Fast screening and heatmaps | Free (delayed); Elite from ~$24.96/mo | Screener, heatmaps, news aggregation | Real-time (Elite) | Web | Limited | Easy |
| Webull | Commission-free trading with research | Free (brokerage account required) | Integrated trading, extended-hours data, basic charting | Real-time | Web, iOS, Android | Brokerage built-in | Easy to moderate |
| TC2000 | Desktop scanning and charting | Free tier; paid from ~$9.99/mo | Advanced scanner, real-time alerts, desktop charting | Real-time (paid) | Web, Desktop, iOS | Brokerage link | Steep learning curve |
| StockCharts | Classic technical charting | Free tier; paid from ~$17.95/mo | Indicator library, chart templates, ACP platform | Delayed (free); real-time (paid) | Web, iOS, Android | Limited | Moderate |
| Thinkorswim | Options and advanced trading | Free (Schwab account) | Options analytics, paper trading, pro-level charts | Real-time | Web, iOS, Android, Desktop | Schwab brokerage | Steep learning curve |
| MarketWatch | Business news and market movers | Free | Editorial coverage, watchlists, movers lists | Delayed | Web, iOS, Android | Limited | Very easy |
| Investing.com | Global markets and economic calendars | Free; Pro from ~$24.99/mo | Economic calendar, multi-asset data, global coverage | Delayed (free) | Web, iOS, Android | Portfolio tracking | Easy |
| Apple Stocks App | Lightweight iOS market tracking | Free (built into iOS) | Clean UI, Apple News integration, basic charts | Delayed | iOS, macOS | Limited | Very easy |
| Stocks+ | Research and community features | Free tier; paid varies | Research tools, social features, basic screening | Delayed | iOS, Android | Limited | Easy |
Fragmented or delayed data creates blind spots in analysis, a point worth keeping in mind when evaluating free tiers. The difference between a 15-minute delay and real-time pricing can matter significantly on a volatile trading day, even for investors who consider themselves long-term holders.
Key things to confirm before choosing:
- Whether the free tier covers your primary use case or just teases it
- Which exchanges and asset classes the app covers (some miss OTC stocks, ETFs, or international listings)
- Whether portfolio sync requires manual entry or connects directly to your brokerage
Individual reviews: which app actually fits your workflow?
Oracleinvestments
Oracleinvestments takes a different approach than most apps on this list. Rather than giving you raw data and asking you to interpret it, the app scores each stock across profitability, valuation, and financial health, then surfaces that score as a single, readable number. You can run a side-by-side comparison of two companies in seconds, which is genuinely useful when you are deciding between two positions in the same sector.
- Scores 260+ stocks using fundamental metrics aligned with value investing principles from Buffett, Munger, and Lynch
- Real-time portfolio tracking with health-check scoring across your holdings
- Side-by-side company comparisons that highlight undervalued candidates quickly
- Built for both beginners and experienced investors; no spreadsheet required
- iOS only (App Store subscription); not a brokerage, so no trading execution
Pricing: Paid subscription via the Apple App Store. Best for: Individual investors who want fast fundamental comparisons and a portfolio health score without building their own models. For a deeper look at how the scoring works, the value rating guide walks through the output in under a minute.
TradingView
TradingView is the charting standard for active traders. The platform's Pine Script language lets you build custom indicators, and the public library of community-shared strategies is genuinely large. The free tier is functional but limits the number of indicators per chart and delays data.
- Extensive charting with hundreds of built-in indicators and drawing tools
- Pine Script for custom strategy development and backtesting
- Active community of traders sharing ideas and annotated charts
- Brokerage integrations allow direct order placement from charts
- Free tier restricts indicator count and real-time data access
Pricing: Free tier available; paid plans from roughly $14.95/month. Best for: Active traders and technical analysts who prioritize charting depth and scripting flexibility.
Yahoo Finance
Yahoo Finance remains the most widely used free stock research app in the United States, largely because it does several things adequately rather than one thing brilliantly. Portfolio sync works across multiple accounts, editorial coverage is consistent, and the interface is familiar to almost everyone.
- Unified portfolio watch with multi-account aggregation
- Strong editorial and news coverage tied directly to your watchlist
- Interactive charts with basic technical overlays
- Yahoo Finance Plus adds premium screeners and real-time data
- Free tier uses delayed pricing data
Pricing: Free; Yahoo Finance Plus available at an additional monthly cost. Best for: Investors who want news-driven context and basic portfolio aggregation without paying anything.
Koyfin
Koyfin sits between a Bloomberg terminal and a consumer app. The dashboards are dense with macro data, sector flows, and multi-asset analytics that most retail-focused apps simply do not offer. It rewards investors who want to understand the broader market context behind individual stock moves.
- High-density data dashboards covering equities, ETFs, macro indicators, and fixed income
- Sector and factor analytics for top-down research
- Customizable workspace with multiple data panels
- Steeper learning curve than consumer-grade apps
- Web-first; mobile experience is more limited
Pricing: Free tier available; paid plans from roughly $19/month. Best for: Investors who need deep macro, sector, and multi-asset context alongside individual stock research. Koyfin also publishes its own comparison of stock analysis apps for readers who want a second perspective.
Seeking Alpha
Seeking Alpha blends long-form contributor analysis with quantitative ratings, which makes it useful for investors who want both a narrative thesis and a data signal. The quant ratings are particularly worth checking before earnings, since they aggregate multiple fundamental factors into a single grade.
- Contributor-written analysis covering thousands of tickers
- Quant ratings that combine multiple fundamental signals
- Earnings alerts and dividend tracking
- Premium tier unlocks full quant scores and contributor ratings
- Free tier limits article access significantly
Pricing: Free tier; Premium from roughly $19.99/month. Best for: Idea-driven investors who want editorial analysis alongside quantitative signals.
Simply Wall St.
Simply Wall St. makes fundamental analysis visual. The "Snowflake" chart breaks a company into five dimensions (value, future, past, health, dividends) and plots them visually, which helps investors who find raw financial statements hard to parse.
- Visual Snowflake scores for quick fundamental assessment
- Plain-language company narratives explaining financial data
- Portfolio sync with health monitoring
- Data is delayed; not suited for active trading decisions
- Coverage is broad but depth can be limited on smaller companies
Pricing: Free tier; paid plans from roughly $10/month. Best for: Long-term, fundamentals-focused investors who prefer visual snapshots over raw data tables.
TipRanks
TipRanks distinguishes itself by tracking analyst performance over time, so you can see not just what analysts are saying but how accurate they have historically been. The Smart Score aggregates analyst consensus, insider transactions, hedge fund activity, and technical signals into a single number.
- Smart Score aggregates analyst ratings, insider activity, and hedge fund moves
- Analyst performance tracking shows historical accuracy by analyst
- Insider transaction alerts with context on buying vs. selling patterns
- Premium tier required for full Smart Score and detailed analyst breakdowns
- Free tier provides limited access to scores and ratings
Pricing: Free tier; Premium from roughly $29.95/month. Best for: Investors who incorporate analyst ratings and insider activity into their research process.
Finviz
Finviz is a screener first and everything else second. The heatmap view of the S&P 500 gives you an instant read on which sectors are moving, and the screener can filter on over 60 fundamental and technical criteria simultaneously. The free version uses delayed data, which is fine for screening but not for execution.
- Fast screener with 60+ fundamental and technical filters
- Visual market heatmaps by sector, industry, and market cap
- News aggregation tied to screener results
- Free tier uses 15-minute delayed data
- No portfolio tracking or brokerage integration
Pricing: Free (delayed); Finviz Elite from roughly $24.96/month with real-time data. Best for: Traders who run quick screen-based scans and want to spot market movers at a glance.
Webull
Webull bundles a commission-free brokerage with research tools, which means you can screen, analyze, and execute in one place. The extended-hours data coverage is a genuine differentiator for traders who watch pre-market and after-hours moves.
- Commission-free trading with integrated research and charting
- Extended-hours and pre-market data included
- Paper trading mode for strategy testing
- Research depth is lighter than dedicated analysis platforms
- Requires opening a brokerage account to access full features
Pricing: Free with a Webull brokerage account. Best for: Cost-conscious active traders who want brokerage and research in a single app.
TC2000
TC2000 is built for traders who run complex scans across thousands of stocks in real time. The condition wizard lets you build multi-criteria alerts without coding, and the desktop client handles large data loads that browser-based tools sometimes struggle with.
- Advanced real-time scanner with multi-condition alerts
- Desktop-grade charting with a large indicator library
- Condition wizard for building complex scans without scripting
- Steeper learning curve; takes time to configure effectively
- Mobile app is functional but less powerful than the desktop version
Pricing: Free tier; paid plans from roughly $9.99/month. Best for: Experienced traders who need robust desktop scanning and real-time alert capabilities.
StockCharts
StockCharts has been a go-to for technically oriented investors for over two decades. The ACP (Advanced Charting Platform) is browser-based but handles a large library of indicators and saved chart templates well. It is less flashy than TradingView but deeply familiar to chart-pattern traders.
- Large library of technical indicators and overlays
- Saved chart templates and scan results
- ACP platform for advanced chart customization
- Free tier uses end-of-day data only
- Community and educational content for learning chart patterns
Pricing: Free tier; paid plans from roughly $17.95/month. Best for: Technically oriented investors who prefer classic charting workflows and a large indicator library.
Thinkorswim
Thinkorswim (now part of Charles Schwab) is the closest thing retail investors have to institutional-grade tools at no extra cost. The options analytics alone, including probability cones, risk profiles, and volatility analysis, justify the platform for any trader who uses derivatives.
- Deep options analytics with probability and risk-profile tools
- Paper trading with real market data for strategy testing
- Pro-level charting with thinkScript for custom indicators
- Steep learning curve; the interface can feel overwhelming at first
- Requires a Schwab brokerage account
Pricing: Free with a Charles Schwab account. Best for: Active traders who want integrated options and derivatives tools alongside pro-level charting.
MarketWatch
MarketWatch is a news platform that happens to include market data, not the other way around. Watchlists and movers lists are useful for staying current, but the research depth stops well short of dedicated analysis tools.
- Strong editorial and breaking news coverage
- Movers lists and market summary data
- Simple watchlist and portfolio tracker
- Limited charting and no screener
- Data is delayed
Pricing: Free. Best for: Investors who prioritize up-to-the-minute business news alongside basic market tracking.
Investing.com
Investing.com covers more asset classes and more global markets than almost any other free app. The economic calendar is particularly useful for macro-aware investors who track Fed decisions, earnings dates, and global data releases in one place.
- Comprehensive economic calendar with global event coverage
- Multi-asset data: equities, forex, commodities, crypto, bonds
- Portfolio tracker with alerts
- Free tier uses delayed data; Pro plan adds real-time data
- Ad-heavy free experience
Pricing: Free; Pro from roughly $24.99/month. Best for: Investors who track international markets and want a single economic-calendar hub.
Apple Stocks App
The Apple Stocks App does exactly what it promises: clean, fast market tracking on iPhone with Apple News integration. It is not a research tool, but for a casual investor who checks prices a few times a day, it requires no setup.
- Built into iOS and macOS; no download required
- Apple News integration surfaces relevant headlines per ticker
- Clean, minimal interface with basic charts
- No screener, no fundamentals, no portfolio cost-basis tracking
- Data is delayed
Pricing: Free (built into iOS). Best for: Casual investors who want lightweight price tracking on iPhone without a separate app.
Stocks+
Stocks+ combines basic research features with community-driven insights, which makes it approachable for newer investors who want some social context alongside their data. Coverage and depth are lighter than dedicated platforms.
- Basic research features with community commentary
- Simple interface suited to newer investors
- Social features for following other investors' ideas
- Limited depth on fundamentals and charting
- Data is delayed
Pricing: Free tier; paid tiers vary by provider. Best for: Newer investors drawn to a combined research-and-community experience.
Pro Tip: If you are comparing a fundamentals-focused app like Oracleinvestments against a charting platform like TradingView, you are not choosing between better and worse. You are choosing between different jobs. Many serious investors use both: one for screening and scoring, one for timing entries.
What core features should a stock analysis app have?
The features below are the ones that materially affect research quality, not just the ones that look impressive in a demo.
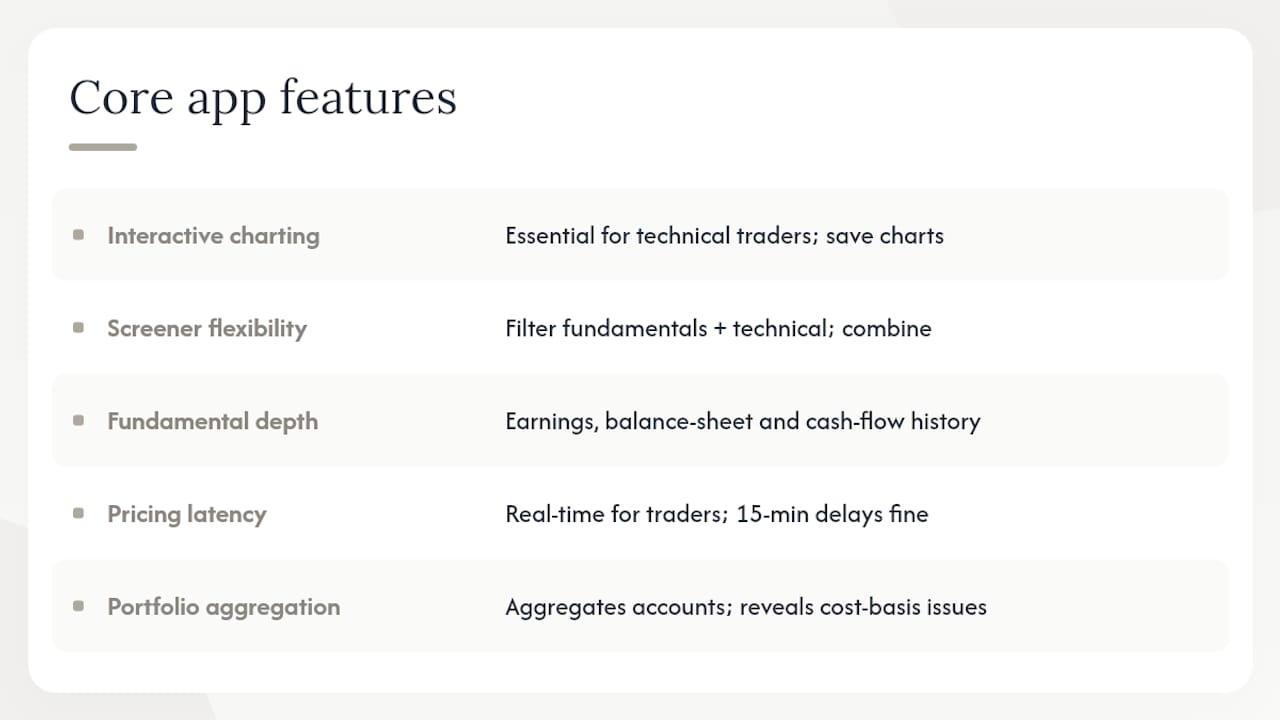
Interactive charting and drawing tools matter most for traders who use technical analysis to time entries and exits. Look for adjustable timeframes, multiple chart types (candlestick, bar, line), and the ability to save annotated charts. Swing traders need this; long-term buy-and-hold investors can often live without it.
Screener flexibility is the difference between finding ideas and waiting for them. A good screener lets you filter on fundamental criteria (P/E ratio, return on equity, debt-to-equity), technical criteria (moving average crossovers, relative strength), and combine them. Finviz and TC2000 lead here; most free apps offer only basic filters.
Fundamental data depth covers earnings history, balance sheet trends, cash flow statements, and valuation multiples over time. For long-term investors, this is the most important feature category. Oracleinvestments distills this into a scored output; platforms like Koyfin and Seeking Alpha give you the raw data to build your own view. Understanding profitability ratios is a good starting point for interpreting what those numbers actually mean.
Real-time vs. delayed pricing is a practical concern that many investors underestimate. A 15-minute delay is irrelevant if you are a long-term investor checking prices once a day. For active traders, it is a genuine liability. Confirm the data latency for your specific use case before paying for a premium tier.
Portfolio aggregation and cost-basis tracking is where most apps fall short. Aggregating multiple brokerage accounts into one research app reveals cross-account concentration risks and cost-basis inconsistencies that a single-broker view misses entirely. Check whether the app connects directly to your brokerages or requires manual CSV imports.
Alerts and news integration keep you informed without requiring you to check the app constantly. The best implementations tie alerts to specific conditions (price crosses a moving average, earnings date approaching) rather than just price thresholds.
Backtesting and strategy testing lets you validate a trading idea against historical data before risking capital. TradingView's Pine Script and Thinkorswim's thinkScript both support this; most consumer apps do not.
AI assistants and recommendations are increasingly common but vary widely in usefulness. The primary value of AI in investing apps is translating complex market data into personalized, portfolio-level insights, not just retrieving data faster. A
shows what is possible with prompt-driven research, but results depend heavily on the quality of inputs and the user's ability to evaluate the output critically.Pro Tip: Always check which exchanges an app covers before trusting its data. Some apps show U.S. equities cleanly but have patchy coverage for OTC stocks, ADRs, or ETFs. If those are part of your portfolio, test them specifically during any free trial.
How do stock analysis app pricing tiers compare?
Most stock analysis apps follow a freemium model: a free tier that covers basic features with delayed data, and one or more paid tiers that unlock real-time data, advanced screeners, and premium research.
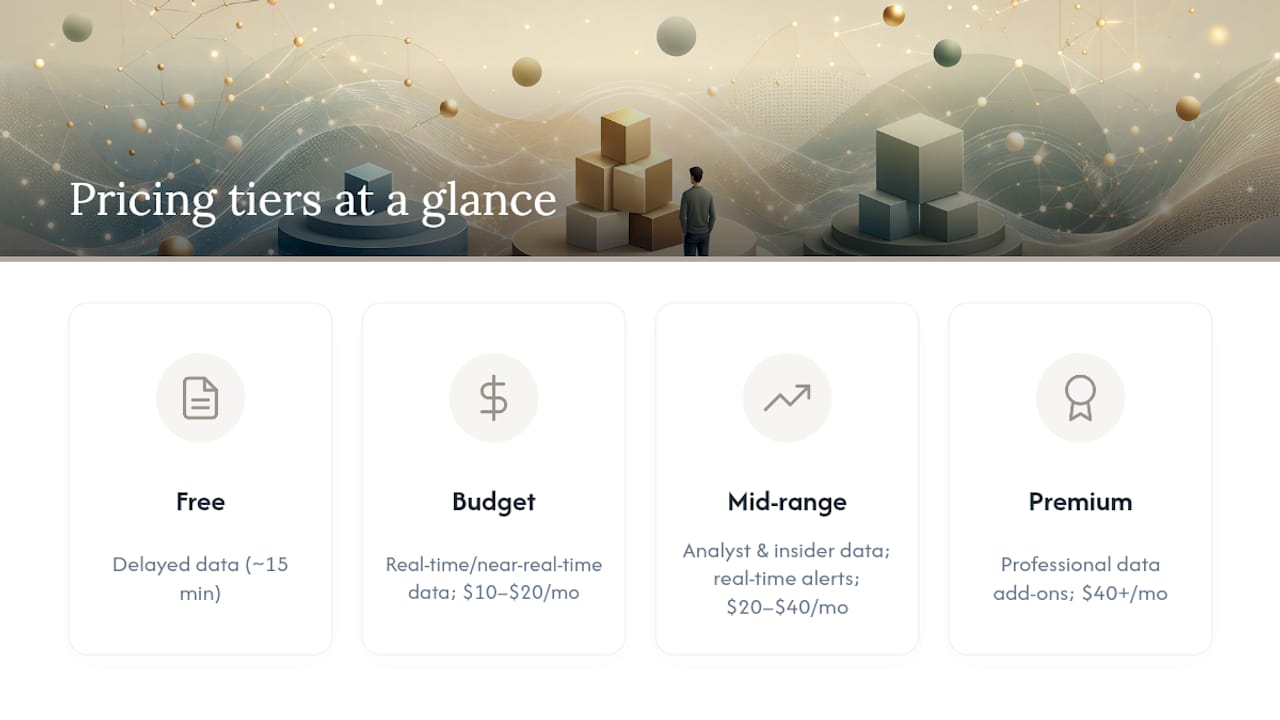
Free tier (no cost): Apps like Yahoo Finance, MarketWatch, Apple Stocks, and the free versions of Finviz and TipRanks fall here. Expect delayed data (typically 15 minutes), limited screener criteria, and restricted access to premium research. These are genuinely useful for casual tracking and basic research.
Budget paid tier ($10–$20/month): Simply Wall St. starts around $10/month, Koyfin around $19/month, and Seeking Alpha Premium around $19.99/month. At this price point, you typically get real-time or near-real-time data, expanded screener access, and more research content. This range covers most individual investors who are serious but not trading daily.
Mid-range paid tier ($20–$40/month): TipRanks Premium runs roughly $29.95/month, Finviz Elite roughly $24.96/month, and Investing.com Pro roughly $24.99/month. These tiers tend to add analyst data, insider tracking, and real-time alerts. Worth the cost if you are actively screening and executing trades.
Premium and enterprise tiers ($40+/month): TradingView's higher plans and professional data add-ons from platforms like Bloomberg or FactSet sit here. Most individual investors do not need this tier.
When is a paid tier worth it? Three clear cases: you need real-time data for active trading, you want multi-account portfolio sync with cost-basis tracking, or you rely on screeners that require more than the 20–30 criteria a free tier typically allows.
Pro Tip: Annual billing typically saves 20–40% versus monthly on most platforms. If you have tested a free trial and are confident in the app, commit annually. If you are still unsure after a free trial, the monthly plan is the right call.
How do you pick the right stock analysis app for your style?
The right app depends on your workflow, not on which platform has the most features. Work through this checklist before committing.
- Define your primary use case. Are you screening for new ideas, charting for entry timing, tracking fundamentals on existing holdings, or monitoring a portfolio? Each use case has a different best tool.
- Test data latency with a real position. Pull up a stock you own and compare the price shown to your brokerage. A 15-minute delay is obvious; a 5-minute delay is not. Know what you are getting.
- Run your actual screener criteria. Do not test a screener with a simple P/E filter. Build the exact multi-criteria screen you would actually use and see how many results it returns and how fast.
- Confirm brokerage integrations. Check whether your specific brokerage is supported for direct sync, not just CSV import. Direct sync is meaningfully more useful for tracking portfolio performance accurately over time.
- Check exchange and asset-class coverage. If you hold ETFs, ADRs, or international stocks, test those tickers specifically. Coverage gaps are common and rarely advertised.
- Compare the trial experience. Most paid tiers offer a 7–14 day free trial. Use it to test the one feature you will rely on most, not the one that looks most impressive.
- Read the privacy and data terms. Some apps sell anonymized user data or share portfolio data with third parties. Check the privacy policy before syncing real account data.
- Test the alert system. Set a price alert and a condition-based alert. See how quickly they fire and whether the notification is useful or just noise.
- Check export options. Can you export your watchlist, portfolio data, or screener results to CSV? Inability to export your own data is a real lock-in risk.
- Verify multi-factor authentication. Any app that connects to brokerage accounts should support MFA. If it does not, that is a hard pass.
Red flags to watch for:
- Pricing that is not clearly listed on the website
- No information about which exchanges or data providers the app uses
- Portfolio sync that only works via manual CSV upload
- No MFA option for accounts with brokerage connections
- Screener results that cannot be exported or saved
Why Oracleinvestments stands out: methodology and honest limits
Oracleinvestments scores stocks across three fundamental dimensions: profitability, valuation, and financial health. Each stock in the 260+ coverage universe receives a composite score that reflects how it performs across these dimensions relative to peers, drawing on the investment frameworks associated with Warren Buffett, Charlie Munger, and Peter Lynch.
The scoring is designed to answer a specific question quickly: is this company financially sound and reasonably priced? That is a different question from "will this stock go up next week," and the distinction matters.
What Oracleinvestments is built for: Fast, fundamental-driven comparisons that surface potentially undervalued companies, support portfolio health checks across your holdings, and give investors a structured framework for side-by-side analysis, without requiring financial modeling skills.
Real use cases where the app adds clear value:
- Running a portfolio health check to identify holdings with deteriorating fundamentals before they become a problem
- Screening for undervalued stocks within a sector using the composite score as a first filter
- Comparing two companies in the same industry side by side when deciding between positions
- Learning value investing principles through the app's integrated educational content
Honest limits to state plainly: Oracleinvestments covers a selected universe of stocks, which means smaller-cap and international names outside that universe are not scored. The app does not include advanced charting, Pine Script-style scripting, or options analytics. For active traders who need real-time technical analysis or derivatives tools, platforms like TradingView or Thinkorswim serve that workflow better. Oracleinvestments is the right primary tool for fundamental-focused investors; it is a complement, not a replacement, for traders who live in charts.
For investors who want to understand how the score outputs translate into practical decisions, the value rating guide explains the scoring in plain language. Readers comparing Oracleinvestments against other fundamental research services will find additional context in the Motley Fool alternatives comparison and the portfolio analysis tools overview.
Key Takeaways
The best stock analysis app is the one that matches your primary workflow: Oracleinvestments for fundamental scoring, TradingView for charting, Yahoo Finance for free news-driven tracking, and Thinkorswim for options-integrated trading.
| Point | Details |
|---|---|
| Match the app to your workflow | Screeners, charting, fundamentals, and portfolio tracking each have a different best tool. |
| Free tiers use delayed data | Most free plans delay pricing by 15 minutes; confirm latency before relying on any free tier for trading decisions. |
| Paid tiers earn their cost in three cases | Real-time data, multi-account portfolio sync, and advanced screeners justify upgrading from free. |
| Test the one feature you will use daily | Run your actual screener, draw on a live chart, or sync your real brokerage during any free trial. |
| Oracleinvestments for fundamental investors | The 260+ stock scoring system gives individual investors a fast, structured way to compare companies and check portfolio health. |
What most investors get wrong about choosing a stock app
The conventional advice is to pick the app with the most features. That is almost always the wrong call.
More features mean more configuration time, more noise, and a steeper learning curve before you get any value. The investors who get the most out of their tools are the ones who chose a single app that does their primary job well, learned it thoroughly, and added a second tool only when they hit a genuine gap.
The other mistake is treating data latency as a binary: real-time good, delayed bad. For a long-term investor who holds positions for months, a 15-minute delay on a stock price is irrelevant. Paying $30/month for real-time data you check twice a week is a waste. The latency question only matters if your strategy actually depends on intraday price moves.
What tends to get underweighted in these decisions is portfolio aggregation. Seeing all your holdings in one place, with accurate cost basis and unrealized gains across accounts, is more practically useful for most investors than any charting feature. Most apps do this poorly. The ones that do it well, with direct brokerage connections rather than manual imports, are worth paying for on that basis alone.
One more thing: AI features in stock apps are genuinely useful when they produce portfolio-level insights and scenario analysis. They are mostly noise when they just repackage the same data in a chat interface. Ask any AI-powered feature a specific, portfolio-relevant question before deciding it adds value.
Oracleinvestments: score your portfolio in 60 seconds
Most stock apps hand you data and leave the interpretation to you. Oracleinvestments does the opposite: it scores each stock on profitability, valuation, and financial health, then shows you exactly where your portfolio is strong and where it is exposed.

For individual investors who want to research like Buffett without building a spreadsheet, the scoring system covers 260+ stocks and updates in real time. You can run a side-by-side comparison of two companies in the same sector, check your portfolio's overall health score, and spot potentially undervalued names, all from your iPhone.
Download Oracleinvestments from the App Store and run your first portfolio health check today.
This article is for general informational purposes only and does not constitute financial or investment advice. Confirm any investment decision with a qualified financial professional.
Sources and further reading
- Oracle — Invest like Buffett. In seconds.
- Best Portfolio Analysis Tools for Investors in 2026
- Best Motley Fool Alternatives for Fundamental Stock Analysis
- How to Track Portfolio Performance Like a Pro
- How to Read a Value Rating in Under a Minute · Oracle