
Sector cyclicality measures how tightly a sector's earnings and stock returns track the broader economy: cyclical sectors like industrials and consumer discretionary swing hard with GDP, while defensive sectors like utilities and staples hold steady. The immediate takeaway for investors is to know your portfolio's cyclical tilt before the cycle turns, not after, and adjust exposure based on where the economy sits in its cycle.
TL;DR:
- A sector’s cyclical nature is confirmed when revenue and profits significantly respond to GDP or industrial production changes over full economic cycles.
- Using a 36-month rolling beta and revenue sensitivity analysis can help identify shifting sector characteristics, especially during rapid economic transitions.
- Sector rotation strategies yield better results when based on evolving leading indicators, with a holding period of at least two to three quarters to avoid mis-timing.
- Macro policies like interest rate adjustments and fiscal stimulus can alter typical cyclicality, making real-time monitoring and flexible analysis essential.
- Oracle Investments provides a scoring tool that automatically assesses profitability, valuation, and financial health to simplify detecting cyclical or defensive stocks.
Table of Contents
- What Sector Cyclicality Means and How It Differs From Defensive Behavior
- How to Identify Cyclical Sectors: Metrics and Signals Investors Can Use
- Sector Behavior Across the Business Cycle: Recovery, Expansion, Slowdown, Recession
- Trading the Cycle: Strategy, Timing Limits, and Risk Controls
- Screening for Sector Cyclicality With a Stock-Scoring App
- Government Policy and Regulation's Role in Sector Cyclicality
- Sector Cyclicality Differs by Region and Market Structure
- Why Sector Cyclicality Is Hard to Measure and Forecast
- A Monitoring Cadence Worth Actually Following
- Apply This Checklist Instantly With Oracle Investments
- Sources
- FAQ
What Sector Cyclicality Means and How It Differs From Defensive Behavior
Cyclicality comes down to one question: does demand for this product disappear when household budgets tighten? Discretionary purchases (a new car, a kitchen remodel, a vacation) get postponed the moment consumers feel nervous. Essential purchases (electricity, prescription drugs, toothpaste) don't. That difference in demand elasticity is the entire engine behind cyclical vs defensive stocks.
Cyclical industries include consumer discretionary, industrials, materials, energy, and financials. These sectors post outsized earnings growth in expansions and outsized earnings declines in contractions, because their revenue rises and falls with consumer confidence, business investment, and commodity demand. Defensive sectors, by contrast, include utilities, consumer staples, and healthcare, and they earn a living regardless of what the economy is doing.
This shows up in the numbers in predictable ways:
- Earnings volatility: Cyclical companies show wide swings in quarterly profit; defensive companies show gradual, almost boring growth.
- Dividend history: Defensive stocks typically carry lower beta, below 1.0, and a long history of consistent dividend payments, since stable cash flow supports a stable payout.
- Cash flow and capex timing: Cyclicals often ramp capital spending late in expansions, right before demand cools, which pressures free cash flow at the worst possible moment.
- Beta: Cyclical stocks typically run at or above a beta of 1.0, amplifying market moves in both directions.
Financial sector cyclicality is a special case worth flagging separately: banks are cyclical through credit demand and loan losses, but they're also directly sensitive to interest rate policy, which can override the usual cycle logic.
How to Identify Cyclical Sectors: Metrics and Signals Investors Can Use
Classifying a stock as cyclical or defensive by gut feel gets you into trouble. Airlines feel cyclical and are. Grocery chains feel defensive and mostly are. But plenty of names sit in a gray zone, and the label can shift over time. A composite, quantitative approach beats a single metric every time.
- Run a rolling beta. Don't rely on a static five-year beta. Calculate a rolling 36-month beta against a broad index and watch how it trends. This single test catches drift that a static number misses entirely.
- Check revenue sensitivity to GDP or industrial production. Regress a company's revenue growth against GDP or industrial production growth. A steep slope signals high cyclicality; a flat line signals defensiveness.
- Measure operating leverage. Companies with high fixed costs relative to variable costs see profits swing harder than revenue in both directions. That amplification is a cyclicality multiplier.
- Track margin dispersion across past cycles. Look at gross and operating margins through at least one full recession and recovery. Wide dispersion confirms cyclical behavior; narrow dispersion confirms defensiveness.
- Watch leading indicators. The Conference Board Leading Economic Index, industrial production data, commodity prices, and hiring reports all telegraph turns before earnings confirm them.
- Layer in earnings-call language and channel checks. Management teams often signal demand softening or capacity additions before it shows up in guidance. Reading between the lines of an earnings call adds a qualitative confirmation layer that pure ratios can't.
Pro Tip: Never classify a stock off a single quarter of beta or revenue data. Cyclicality is a pattern across at least one full cycle, and a company can look temporarily defensive during an unusual demand spike (think home goods retailers in 2020) before reverting hard.
Sector Behavior Across the Business Cycle: Recovery, Expansion, Slowdown, Recession
Institutional sector rotation strategies typically segment the economy into four phases using leading indicators like the LEI, and each phase has historically favored a different set of sectors.
- Recovery: Growth troughs and starts turning up, credit conditions ease, and confidence improves off a low base. Consumer discretionary, industrials, and small caps tend to lead as pent-up demand releases and financing gets cheaper.
- Expansion: Growth accelerates and broadens. Technology, industrials, and materials typically extend their gains as capital spending and hiring pick up across the board.
- Slowdown (late cycle): Growth is still positive but decelerating, inflation often runs hot, and the yield curve frequently flattens. Energy and materials can still perform, but investors start rotating toward quality and less rate-sensitive names.
- Recession: Growth turns negative. Staples, utilities, and healthcare typically hold up best because their earnings barely notice a shrinking economy, while cyclicals get hit hardest.
This mapping, drawn from SSgA's business-cycle sector framework, holds up reasonably well historically, but it isn't a fixed law. Structural shifts and one-off shocks reshuffle the deck. Rolling beta data shows semiconductor betas climbing from roughly 1.0 to 1.2 up to around 1.7 by mid-2024, a sizable jump that reflects the sector's growing entanglement with AI capital spending cycles rather than traditional consumer demand. A sector that behaved defensively in one decade can behave cyclically in the next.
Trading the Cycle: Strategy, Timing Limits, and Risk Controls
Sector rotation isn't just a chart-reading exercise. Academic research covering 1985 to 2014 found that rotation strategies tied to business-cycle regimes generated meaningful abnormal returns, largely because investors underreact to how business-cycle shifts change industry-level cash-flow growth. The market is slow to price in the second-order effects of a cycle turn, and that lag creates an exploitable window.
That said, timing the exact turn is nearly impossible, and most amateur attempts at sector rotation lose money to poor execution rather than bad theory. A few rules keep the strategy honest:
- Set a horizon before you rotate. Sector cycles play out over quarters, not days. Commit to holding a rotation call for at least two to three quarters unless the thesis breaks.
- Size positions modestly. Cap any single sector tilt so a wrong call doesn't wreck the portfolio.
- Rebalance on a fixed cadence. Monthly or quarterly rebalancing avoids the cost drag of constant trading; frequent rebalancing eats returns through transaction costs and tax friction.
- Layer a quality or value overlay. Within a cyclical sector, favor companies with lower debt and stronger margins to soften the downside.
- Use stop-loss discipline sparingly, and know that sequence-of-returns risk matters more for investors near retirement than for younger accumulators.
Screening for Sector Cyclicality With a Stock-Scoring App
Running rolling betas, margin dispersion, and revenue sensitivity by hand across a whole portfolio takes hours. A scoring tool compresses that work into seconds by surfacing the underlying fundamentals side by side.
- Profitability and financial-health scores flag which cyclical names are entering a downturn with a weak balance sheet versus a strong one.
- Valuation scores show whether a cyclical stock's price has already priced in a slowdown or is lagging the fundamentals.
- Side-by-side comparisons across dozens of names at once let you spot which sector exposures in your portfolio have drifted since your last review.
None of this replaces macro judgment. A tool can tell you a company's margins compressed last quarter; only you can decide whether that's cyclical noise or the start of a structural decline. Keep manual checks like reading the earnings call transcript in the loop.
Government Policy and Regulation's Role in Sector Cyclicality
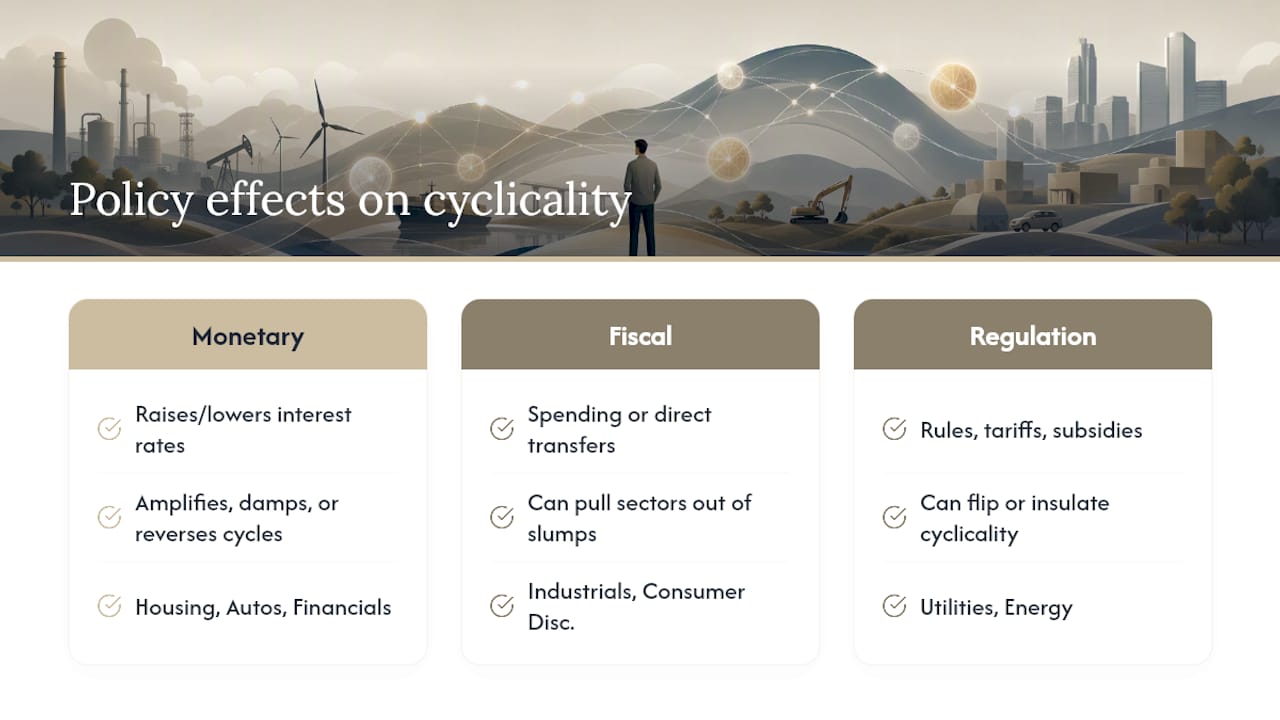
Fiscal and monetary policy can amplify, dampen, or occasionally override a sector's natural cyclical tendency. Interest rate policy is the clearest example: when a central bank raises rates to fight inflation, capital-intensive cyclical sectors like housing and autos slow almost immediately because financing costs rise, while rate-sensitive financials see their lending margins shift in the opposite direction from what you'd expect during a typical slowdown.
Fiscal stimulus works the same lever in reverse. Large infrastructure spending bills or direct consumer stimulus checks can pull cyclical sectors like industrials and consumer discretionary out of a slump faster than the underlying private economy would manage alone. This happened visibly during pandemic-era stimulus, when consumer discretionary spending snapped back well ahead of typical recovery-phase timing because government transfers replaced lost wages directly.
Regulation reshapes cyclicality at the industry level too. Environmental rules, tariff policy, and subsidy programs can turn an otherwise cyclical sector defensive, or the reverse. Utilities are defensive partly because regulators guarantee their rate of return, insulating earnings from demand swings that would otherwise hit a normal cyclical business. Energy sector cyclicality gets scrambled by production quotas, export restrictions, and green-energy subsidies that shift demand curves independent of the broader economy. Any investor building a cyclicality score for a heavily regulated industry needs to treat policy risk as a distinct variable, not a footnote.
Sector Cyclicality Differs by Region and Market Structure
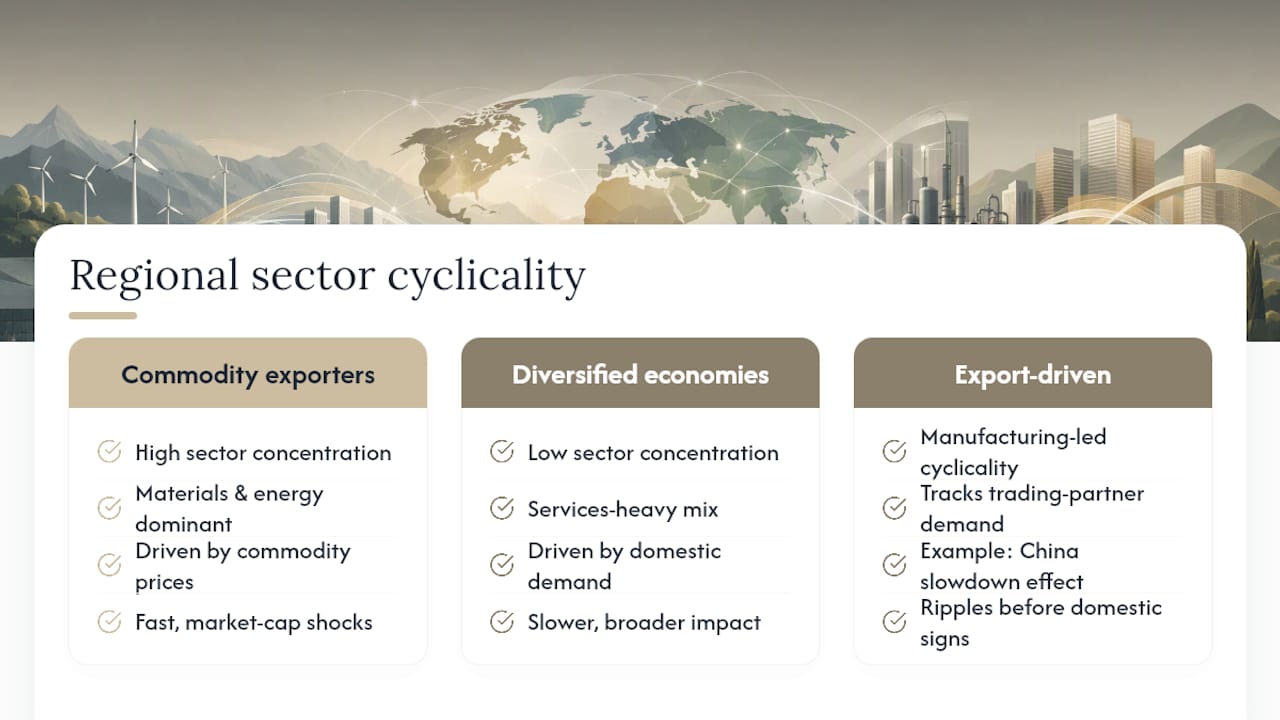
A sector's cyclical profile isn't universal. It depends heavily on what drives that region's economy and how its markets are structured. Commodity-exporting economies concentrate cyclical risk in materials and energy far more heavily than diversified economies, because a much larger share of GDP and equity market capitalization sits in those sectors. A downturn in global commodity prices hits those markets harder and faster than it hits a services-heavy economy.
Emerging markets often show sharper sector cyclicality swings than developed markets, partly because emerging-market financial sectors are more exposed to currency volatility and capital flow reversals. A rate hike in a major developed economy can trigger capital flight from emerging-market banks that dwarfs anything happening in the real economy of that country.
Export-driven economies add another layer: their industrial and manufacturing sectors track the demand cycle of their trading partners as much as their own domestic cycle. A slowdown in Chinese industrial output, for example, ripples through export-heavy manufacturing sectors in other countries well before those countries' own domestic indicators show any stress. Investors building a global sector-rotation strategy need region-specific beta and correlation data. Applying a US-calibrated cyclicality model to a different market's sector mix, without adjusting for its trade exposure and industry weighting, produces a distorted signal.
Why Sector Cyclicality Is Hard to Measure and Forecast
Every diagnostic covered so far comes with a catch. Beta is backward-looking by construction, and a rolling 36-month window smooths out the exact inflection point where a sector's character starts shifting. By the time the data confirms a beta increase, a chunk of the transition has already happened in the market.
Leading indicators like the LEI help, but they're imperfect too. They can flash false signals during periods of unusual policy intervention, and revisions to underlying economic data sometimes redraw the picture months after the fact. Structural shocks make forecasting harder still: a pandemic, a technology platform shift, or a sudden trade policy change can permanently reclassify a sector's cyclicality rather than just producing a temporary blip, which is exactly what happened with semiconductor betas. A model trained on pre-shock data simply doesn't see the new regime coming.
There's also a classification problem hiding underneath all of this. Companies increasingly straddle sector lines: a "consumer discretionary" company with a subscription revenue model behaves more like a defensive staple than its sector label suggests. Sector cyclicality analysis remains a probabilistic tool, not a precise forecasting instrument, and treating any single metric as gospel is the fastest way to misjudge a portfolio's real risk.
A Monitoring Cadence Worth Actually Following
Check LEI trends, rolling betas, and margin data monthly, not quarterly. Run a 36-month rolling-beta screen on your largest cyclical positions this week. Build a rules-based review process. Don't try to time the exact turn.
— Matt
Apply This Checklist Instantly With Oracle Investments
Oracle Investments scores more than 260 stocks on profitability, valuation, and financial health, and lets you compare candidates side by side instead of building spreadsheets from scratch. Every diagnostic covered above (margin trends, financial-health flags, valuation relative to fundamentals) is exactly what the app surfaces automatically for each stock in your watchlist.

The app's ratings are rule-based and built directly from reported company fundamentals rather than model-driven guesswork, and every scoring input is shown transparently so you can see exactly why a stock scores the way it does. Paired with real-time portfolio tracking, it gives you a fast way to spot when a cyclical position's underlying financial health is shifting, without waiting for a quarterly earnings recap to catch up. It also folds in investment principles from Warren Buffett, Charlie Munger, and Peter Lynch, so the diagnostics come with context, not just numbers.
If you want to put this article's checklist to work on your own portfolio, start with the Premium Annual plan and run your highest cyclical exposures through the scoring engine today.
Sources
- Cyclical stocks, defensive investing — Britannica
- When sector cyclicality changes — LSEG / FTSE Russell
- Sector business cycle analysis — SSgA
- Does history repeat itself? Business cycle and industry returns — ScienceDirect
This article is general information, not a substitute for advice from a qualified financial advisor. Consult a qualified financial professional about your own circumstances before acting on anything here.
FAQ
What Is Cyclicality in Investing?
Cyclicality is the degree to which a company's or sector's earnings move with the broader economy. Highly cyclical businesses see profits expand sharply during growth and contract sharply during downturns, while defensive businesses show far more stable earnings across the full economic cycle.
What Is an Example of a Cyclical Industry?
Automakers are a classic example: car sales drop fast when consumers lose confidence or credit tightens, and rebound quickly once conditions improve. Homebuilders, airlines, and industrial equipment makers follow the same pattern for similar reasons.
What Are Cyclical and Non-Cyclical Sectors?
Cyclical sectors, including consumer discretionary, industrials, materials, and energy, expand and contract with GDP growth. Non-cyclical, or defensive, sectors, including utilities, consumer staples, and healthcare, maintain steadier earnings and lower beta regardless of where the economy stands.
What Are Cyclical Industries?
Cyclical industries sell goods or services people can delay buying when money gets tight, such as vehicles, luxury goods, travel, and heavy machinery. Their revenue and stock prices tend to track industrial production and consumer confidence closely, and tools that score financial health and valuation side by side can help flag which cyclical names are better positioned heading into a downturn.