
Volatility measures total return swings; beta measures how much of that swing tracks the broader market. Volatility is the standard deviation of an asset's own returns, full stop. Beta compares that movement to a benchmark and depends mathematically on correlation and relative volatility. In practice, use volatility to gauge how bumpy the ride will be, and use beta to gauge how much of that bumpiness comes from the market itself.
TL;DR:
- A stock's volatility can vary widely depending on the sample window, with short-term measures often understating long-term swings.
- A beta of 1.5 indicates the stock tends to move 1.5 times more than the market, but beta can change significantly during market stress.
- Both metrics are backward-looking and can shift after corporate changes or market cycles, making it necessary to update estimates regularly.
- Asset class influences both volatility and beta, with stocks typically more volatile than bonds and cryptocurrencies showing extreme swings but low beta correlations.
- Combining volatility with fundamentals and stress-testing scenarios provides a more comprehensive understanding of risk than relying on one metric alone.
Table of Contents
- What Is Volatility in Investing?
- What Is Beta and How Do You Read It?
- How Are Beta and Volatility Mathematically Connected?
- When Should You Use Beta vs Volatility?
- What Are the Biggest Misunderstandings About Beta and Volatility?
- How Do You Calculate Beta and Volatility Yourself?
- How Do Market Conditions Change Beta and Volatility Readings?
- How Do Beta and Volatility Compare Across Stocks, Bonds, and Other Assets?
- How Do Beta and Volatility Feed Into the Sharpe Ratio and Other Risk-Adjusted Measures?
- My Take: How I Actually Use These Two Numbers
- Sources
What Is Volatility in Investing?
Volatility is the standard deviation of an asset's returns over a chosen period. Take a stock's daily or monthly returns, find the average, measure how far each return strays from that average, and you get a number that describes how wildly the price swings in either direction. FINRA defines it as total dispersion of returns, covering both gains and losses, not just downside moves.
That last point trips up a lot of new investors.
Volatility also depends heavily on the sample window you choose. A stock's 30-day volatility can look calm while its 5-year volatility tells a much rougher story, especially for names that went through a specific crisis or earnings shock.
Statistic Callout: A stock's standard deviation calculated over one quarter of low trading activity can understate its true long-term swings by a wide margin, which is why analysts typically check multiple time windows before trusting a single volatility figure.
Practical takeaways on reading volatility:
- Higher standard deviation means bigger price swings, in both directions.
- Volatility says nothing about why the price is moving, only how much.
- Short sample periods can flatter or distort the real picture.
- Two assets with the same volatility can behave completely differently in a crash.
What Is Beta and How Do You Read It?
Beta measures how sensitive a stock is to movements in a benchmark index, which is assigned a beta of exactly 1. The Corporate Finance Institute frames beta as systematic risk exposure: how much of a stock's movement is explained by the market itself, rather than by anything specific to that company.
The formula is:
β = covariance(stock, benchmark) / variance(benchmark)
That covariance term captures how the stock and the market move together, while variance measures how much the benchmark itself bounces around.
A few numbers make this concrete:
- Beta of 1.5 means the stock has historically moved 1.5% for every 1% move in the benchmark.
- Beta of 0.5 means the stock moves only about half as much as the market, in the same direction.
- Negative beta means the stock tends to move opposite the market, which is rare and usually shows up in assets like gold miners during certain cycles.
Beta only captures systematic risk, the part of a stock's movement tied to the broader market. It says nothing about company-specific events like a lawsuit or a product recall.
How Are Beta and Volatility Mathematically Connected?
Beta isn't an independent number. It's built directly from correlation and volatility, expressed as:
β_i = ρ_{i,m} × (σ_i / σ_m)
Here ρ is the correlation coefficient between the stock and the benchmark, σ_i is the stock's own volatility, and σ_m is the benchmark's volatility. This identity, laid out in Investopedia's explanation of beta, shows why the two metrics can point in opposite directions.
Three scenarios illustrate the split:
- High volatility, low beta: a biotech stock swinging wildly on trial results but barely correlated to the S&P 500.
- Low volatility, high beta: a slow-moving utility stock with a beta near 1 during a calm market, where small market wiggles still track closely.
- Nonlinear cases: options and other derivatives, where beta breaks down entirely because payoffs aren't proportional to the underlying's moves.
Pro Tip: Correlation isn't fixed. It tends to spike toward 1 during market crashes, when nearly everything sells off together, which is exactly when a "low beta" stock can suddenly start behaving like a high-beta one. Check correlation stability across at least one down cycle before trusting a beta figure.
When Should You Use Beta vs Volatility?
Pick the metric that matches the question you're actually asking. Volatility answers "how much could this swing?" Beta answers "how much of that swing is tied to the market?"
Use volatility when you're stress-testing a position for worst-case scenarios or sizing a bet based on how much drawdown you can tolerate. Use beta when you're building a diversified portfolio and need to know how much overall market exposure you're stacking up across holdings.
Neither metric works well alone. A stock's beta might look tame while its fundamentals, like a bloated debt load or shrinking margins, tell a riskier story that neither number captures.
A simple process for applying both:
- Pick your timeframe. Compare at least three years of data, not three months.
- Benchmark against peers. A beta of 1.2 means little without knowing the sector average.
- Compute portfolio beta. Weight each holding's beta by its portfolio share to see aggregate market exposure.
- Stress-test with volatility. Model how a 20% market drop would hit your highest-volatility positions specifically.
Oracle Investments' portfolio risk workflow walks through this kind of layered approach in more detail.
What Are the Biggest Misunderstandings About Beta and Volatility?
Both metrics are backward-looking. They describe what already happened, not what will happen next quarter. A stock's five-year beta can shift meaningfully after a merger, a new product line, or a change in leadership.
Sample bias is a related trap: a beta calculated only during a bull market often understates how a stock behaves in a downturn, because correlations shift under stress.
The most common mistake is treating volatility as synonymous with risk of loss. RBC Wealth Management points out that the real danger for most investors isn't volatility itself but being forced to sell during a downturn, a problem better known as sequence-of-returns risk.
Ways to guard against these blind spots:
- Use longer sample windows, ideally spanning at least one full market cycle.
- Pair volatility with downside-focused metrics like maximum drawdown.
- Combine beta with fundamentals, since it says nothing about balance sheet quality.
- Recheck beta periodically. It drifts as a company's business mix changes.
For a deeper look at why forced selling matters more than volatility itself, see Oracle Investments' piece on sequence of returns risk.
How Do You Calculate Beta and Volatility Yourself?
You don't need anything fancier than a spreadsheet to reproduce both numbers. This is the same basic method used in FRM-level teaching materials:
- Gather monthly returns for your stock and a benchmark like the S&P 500 over 36 months. Calculate the average return for each.
- Compute standard deviation of the stock's returns. Subtract the mean from each monthly return, square it, average those squared differences, then take the square root. That result is your volatility.
- Compute covariance between the stock and benchmark returns, then divide by the benchmark's variance. That gives you beta.
Statistic Callout: Say your 36-month calculation produces a stock standard deviation of 8% monthly against a benchmark standard deviation of 4%, with a correlation of 0.6. Beta works out to 0.6 × (8/4) = 1.2, meaning the stock has historically amplified market moves by 20%, despite having double the market's raw volatility.
How Do Market Conditions Change Beta and Volatility Readings?
Both metrics move with the market cycle, and they don't always move together. During calm, low-volume markets, volatility readings across most stocks tend to compress toward historically low levels, while beta estimates can become noisier because there's less market movement to correlate against in the first place.
Crisis periods flip this. Volatility spikes across nearly every asset class as trading volume surges and price swings widen, which is straightforward to observe in any standard deviation calculation. Beta behaves less predictably. Correlations across stocks and sectors tend to converge toward 1 in a sharp sell off, a phenomenon sometimes described as "correlation going to one." A stock that behaved like a low-beta defensive name in calm markets can suddenly track the index almost perfectly during a panic, because everyone is selling everything at once regardless of fundamentals.
This is why a beta calculated purely from a bull market period, like a long stretch of low rates and steady growth, often understates how a stock will actually behave once volatility returns. Rolling or regime-specific beta calculations) help catch this instability by showing how the coefficient shifts across different market environments rather than relying on one static, multi-year average that blends calm and chaotic periods together.
The practical lesson: never treat a single beta or volatility figure as permanent. Both are snapshots of a relationship that can change the moment market conditions do.
How Do Beta and Volatility Compare Across Stocks, Bonds, and Other Assets?
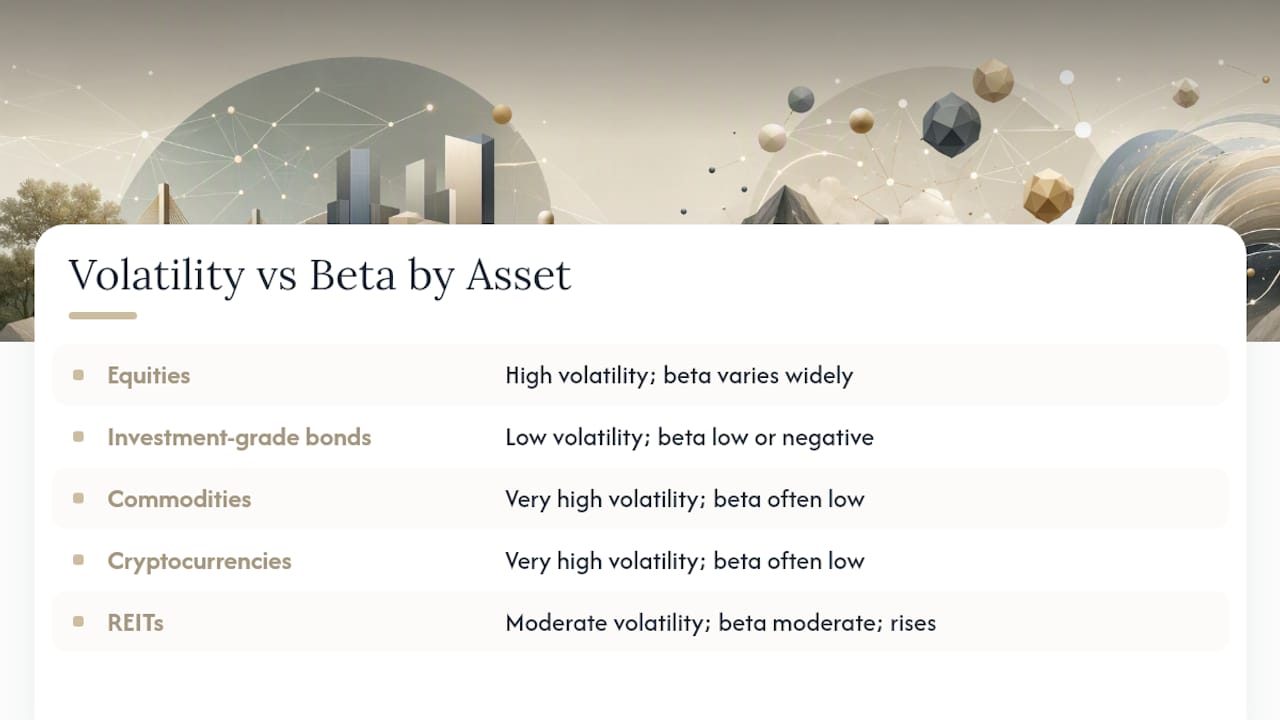
Asset class drives both numbers in predictable ways, though the relationship between them shifts depending on what you're holding. Equities generally carry the highest volatility of the traditional asset classes, and individual stock betas can range widely, from under 0.5 for utilities to well above 1.5 for speculative growth names.
Bonds tell a different story. Investment grade bonds typically show much lower volatility than stocks, and their beta relative to an equity benchmark is often low or even negative during flight to quality episodes, when investors sell stocks and buy government debt simultaneously. That negative correlation is exactly why bonds show up in diversified portfolios even though their standalone returns look modest.
Commodities and cryptocurrencies sit at the other extreme on volatility, frequently posting standard deviations that dwarf even aggressive growth stocks. Their beta to equity benchmarks, however, can be surprisingly low, since price moves are often driven by supply shocks, currency effects, or sentiment cycles that have little to do with the stock market's day-to-day direction.
Real estate investment trusts and other yield-driven assets often land in the middle: moderate volatility, with beta that tends to rise during periods when investors treat REITs as equity proxies rather than as their own asset class. The pattern across all of this is consistent. Volatility tells you how much an asset class moves on its own; beta tells you how much of that movement is tied to equities specifically, and the two frequently diverge the further you get from plain stock indices.
How Do Beta and Volatility Feed Into the Sharpe Ratio and Other Risk-Adjusted Measures?
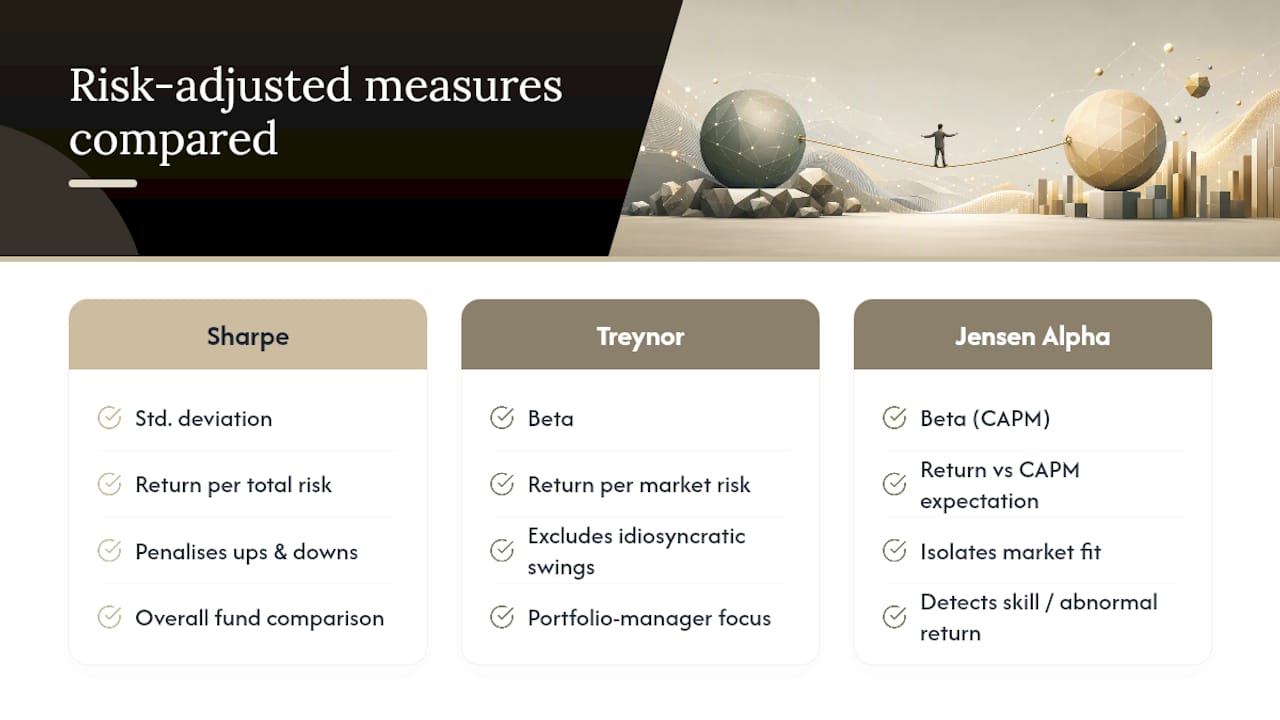
Risk-adjusted performance measures exist because raw returns alone don't tell you whether a gain was earned efficiently or came from taking on excessive risk. The Sharpe ratio is the most common example, and it uses volatility directly in its denominator: excess return over the risk-free rate, divided by standard deviation.
A high Sharpe ratio means an investment generated strong returns relative to how much it bounced around, while a low Sharpe ratio flags a bumpy ride that didn't pay off proportionally. Because the Sharpe ratio relies on total volatility, it penalizes upside swings the same way it penalizes downside ones, which is a known quirk worth remembering when comparing two funds with very different return distributions.
Beta feeds into a related measure called the Treynor ratio, which divides excess return by beta instead of standard deviation. That distinction matters for portfolio managers specifically, because the Treynor ratio isolates how well a fund was compensated for market risk alone, stripping out the idiosyncratic swings that a Sharpe ratio would still capture.
Jensen's alpha goes a step further, using beta to calculate the return a stock or fund should have produced given its market exposure, then comparing that expectation to actual performance. A positive alpha suggests genuine skill or an edge beyond simple market exposure. Combining these measures, rather than leaning on any single one, gives a fuller picture of whether returns reflect smart decisions or just a willingness to absorb more risk.
My Take: How I Actually Use These Two Numbers
I run a short checklist before trusting either number: confirm the sample period covers at least one down cycle, check whether correlation held up during that stress, compare the figure against sector peers, and cross-check against basic fundamentals like debt levels and margins. If a "low beta" stock's correlation jumps during a sell off, I treat that beta as unreliable, not defensive.
Say a holding shows low beta but rising volatility over six months. I don't drop it automatically. I check whether that volatility is company-specific news or a market-wide shift first, then size the position accordingly rather than reacting to one number in isolation.
For readers who want to apply this kind of comparison directly to real holdings, Oracle Investments scores stocks on fundamentals alongside price behavior, and the risk-adjusted returns guide on our blog walks through blending these metrics further.
— Matt
This article is general information, not a substitute for advice from a qualified financial advisor. Consult a qualified financial professional about your own circumstances before acting on anything here.
Sources
- What is Beta? | Corporate Finance Institute
- Volatility | FINRA
- The difference between volatility and risk | RBC Wealth Management
- Beta — Investopedia