
The required rate of return (RRR) is the minimum return an investor demands to accept an investment's risk, and it works as the pass/fail line for every opportunity you evaluate. If the expected return clears your RRR, the investment is worth considering; if it doesn't, you walk away. This guide shows three ways to calculate it: the Capital Asset Pricing Model (CAPM), the weighted average cost of capital (WACC), and the dividend discount model.
TL;DR:
- The required rate of return depends on the investor's risk tolerance and is adjusted based on whether evaluating individual stocks or corporate projects.
- Choosing the wrong model, such as CAPM for dividends or WACC for project-specific judgments, can lead to significant valuation errors.
- Recalculating inputs like beta and risk-free rates annually ensures your RRR remains aligned with market conditions.
- Using ranges and sensitivity testing around your RRR provides a more realistic margin of error than relying on a fixed number.
- Ultimately, estimating RRR involves judgment, adjustments, and constantly revisiting assumptions rather than relying solely on formulas.
Table of Contents
- What Does Required Rate of Return Actually Mean?
- How Do You Calculate the Required Rate of Return?
- How Do You Calculate RRR With CAPM and WACC?
- Practical Rules for Choosing a Reliable RRR
- Why RRR Still Comes Down to Judgment, Not Just Formulas
- Where These Numbers Come From
- An Honest Take on Treating RRR Like a Fixed Number
- Run Your Own RRR Calculations Without the Spreadsheet Headache
- Sources
- FAQ
What Does Required Rate of Return Actually Mean?
Think of RRR as your opportunity cost made explicit. It answers one question: what return could you earn elsewhere for taking on similar risk? Investopedia defines RRR as the minimum return an investor will accept given an investment's risk, and if the expected return falls short, the deal typically gets rejected. That framing matters more than it sounds, because people routinely confuse RRR with three related but distinct numbers.
Here's how they differ:
- Expected return is a forecast, what you think an asset will actually deliver.
- Internal rate of return (IRR) is derived from a specific project's cash flows. It tells you the return that project generates, not the minimum you'd accept.
- Discount rate is the rate used to bring future cash flows back to present value. RRR often serves as that discount rate, but the two concepts aren't identical.
- WACC is a firm-level cost of capital, blending what a company pays for debt and equity.
Who sets the number changes depending on the decision. An individual investor picking stocks usually builds a personal RRR from CAPM, reflecting their own risk tolerance and market exposure. A corporate finance team evaluating a new factory or product line typically starts with WACC and layers on a project-specific risk premium. MIT OpenCourseWare's discussion of discount rates makes the same point: the rate you choose has to reflect what you're actually giving up by choosing this investment over the next best alternative. Get that wrong and every number downstream, from valuation to buy/sell decisions, inherits the error.
How Do You Calculate the Required Rate of Return?
Three models dominate real-world practice, and each fits a different situation. Picking the wrong one for your use case is one of the most common mistakes DIY investors make.
CAPM is the workhorse for individual stock selection, especially for companies that don't pay dividends. The formula:
RRR = Risk-Free Rate + Beta × (Market Return − Risk-Free Rate)
The risk-free rate typically comes from the 10-year U.S. Treasury yield, though some analysts prefer the shorter 3-month bill for shorter holding periods. Beta measures a stock's volatility relative to the broader market equities, though estimates vary by source and time period.
WACC is the right tool when you're evaluating a company's cost of capital or setting a firm-level hurdle rate for a new project. The formula:
WACC = (E/V × Re) + (D/V × Rd × (1 − Tax Rate))
Here, E and D are the market values of equity and debt, V is total value (E + D), Re is the cost of equity (often calculated via CAPM), and Rd is the cost of debt, adjusted downward for the tax shield since interest payments are deductible. Corporate Finance Institute notes that WACC commonly serves as a company's baseline hurdle rate, with riskier projects requiring a premium above it.
The Dividend Discount Model (Gordon Growth Model) works only for stable, dividend-paying companies:
RRR = (D1 / P0) + g
D1 is the expected dividend next year, P0 is the current stock price, and g is the dividend's expected long-term growth rate. It's elegant but fragile. A mature utility with 40 years of steady payouts fits neatly. A growth stock with an erratic or nonexistent dividend history breaks the model immediately.
- Match your inputs to the same time period: don't mix a nominal risk-free rate with a real (inflation-adjusted) growth estimate.
- Use consistent data sources for beta and market premium rather than blending numbers from different providers with different methodologies.
Pro Tip: Recalculate your beta and risk-free rate at least once a year. Both drift meaningfully over a market cycle, and a stale CAPM input can quietly skew every valuation you run for months.
How Do You Calculate RRR With CAPM and WACC?

Numbers make this concrete. Here's a full walkthrough using each method.
CAPM example:
- Risk-free rate (10-year Treasury yield): 4.0%
- Beta: 1.3 (a moderately volatile tech stock)
- Market risk premium: 5.5%
- Apply the formula: RRR = 4.0% + 1.3 × 5.5% = 4.0% + 7.15% = 11.15%
WACC example:
- Equity weight: 70%, cost of equity: 12% (from CAPM)
- Debt weight: 30%, pre-tax cost of debt: 6%, tax rate: 21%
- After-tax cost of debt: 6% × (1 − 0.21) = 4.74%
- WACC = (0.70 × 12%) + (0.30 × 4.74%) = 8.4% + 1.42% = 9.82%
Neither number should stand alone. The Congressional Budget Office recommends treating discount rates as a range rather than a single fixed figure, because inputs like inflation and market performance are genuinely uncertain.
Practical Rules for Choosing a Reliable RRR
Rough benchmarks help, but treat them as starting points, not gospel. Ranges beat single numbers because they force you to acknowledge what you don't know.
Before you commit to a figure, run through this checklist:
- Confirm whether you're working in nominal or real terms, and keep every input consistent with that choice.
- Match the Treasury maturity to your investment horizon; a 10-year yield fits a long-term equity hold better than a 3-month bill.
- Justify your market premium and beta selection instead of defaulting to whatever number appears first in a search result.
- Write down your assumptions somewhere you'll actually revisit them.
The most common mistakes are avoidable once you know to look for them. Mismatching cash flow types, discounting real cash flows with a nominal rate, is a frequent and quiet source of valuation error, and Investopedia flags this nominal/real mismatch as one of the more persistent pitfalls in RRR work. Using a beta borrowed from a company in a different industry, ignoring liquidity constraints on a long-term holding, or treating a single-point RRR as gospel instead of a working estimate all lead to the same problem: false precision.
A better workflow: compute your base case, stress-test it with a sensitivity range, document every assumption you made and why, then revisit the whole thing when interest rates or market conditions shift meaningfully.
Pro Tip: *Keep a simple spreadsheet log of your RRR assumptions for each holding, including the date you last updated them.
Why RRR Still Comes Down to Judgment, Not Just Formulas
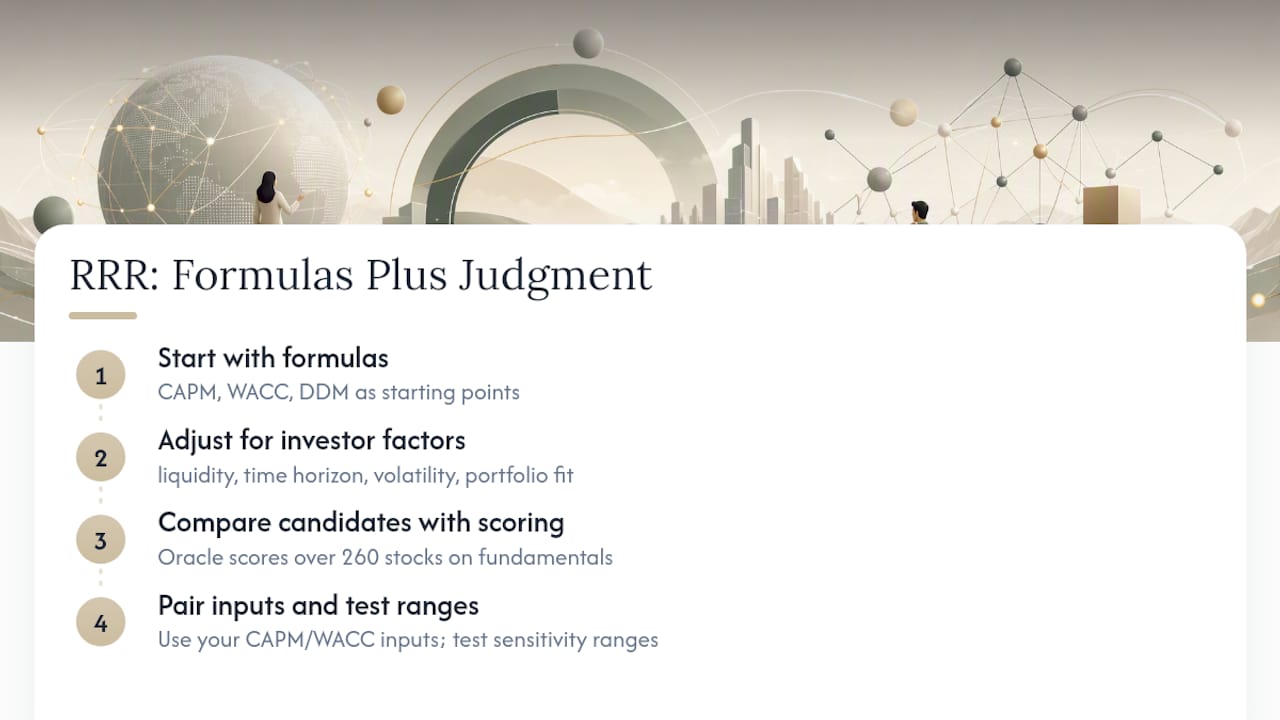
CAPM, WACC, and the dividend discount model give you defensible starting points, but none of them removes the need for judgment. A textbook beta doesn't know about your liquidity needs, your time horizon, or how much volatility you can stomach without selling at the wrong moment. Professional analysts lean on the formulas, then adjust for portfolio fit and document why.
That's the gap most retail tools ignore. Oracle Investments scores over 260 stocks on profitability, valuation, and financial health, letting you compare candidates side by side instead of running each RRR calculation from scratch in a spreadsheet. Pairing that scoring with your own CAPM or WACC inputs, and testing a sensitivity range rather than trusting one number, is how you avoid the false-precision trap.
Where These Numbers Come From
The formulas and reasoning above draw on a handful of sources worth bookmarking. Investopedia's RRR entry covers the core definition and model selection. Corporate Finance Institute breaks down WACC mechanics in more depth. The Congressional Budget Office's discount rate guidance makes the case for sensitivity ranges, and MIT OpenCourseWare's project evaluation materials explain the opportunity-cost logic underneath it all.
An Honest Take on Treating RRR Like a Fixed Number
RRR looks like pure math until you actually try to use it. Every formula here depends on inputs you have to choose, a beta, a growth rate, a market premium, and none of those choices are obvious. The professionals who get this right don't chase a perfect number. They compute a base case, test it against a low and high scenario, write down why they picked what they picked, and revisit it when the Fed moves rates or a company's fundamentals shift. Treat your RRR as a living estimate, not a constant, and you'll make better decisions than anyone chasing false precision to two decimal places.
— Matt
Run Your Own RRR Calculations Without the Spreadsheet Headache
Building a CAPM or WACC model from scratch works fine for one stock. It gets tedious fast once you're comparing ten candidates and testing sensitivity ranges on each. Some investment tools score stocks on profitability, valuation, and financial health, so you can see where a company stands before you spend time hand-calculating its hurdle rate.

Some apps include portfolio tracking and instant side-by-side comparisons, and incorporate investment principles from legendary investors, helping to inform your RRR inputs. If you're weighing whether a stock clears your threshold, or checking how a value rating breaks down before you finalize a number, start by pulling up the stock on Oracle Investments and comparing it against your watchlist.
This article is general information, not a substitute for advice from a qualified financial advisor. Consult a qualified financial professional about your own circumstances before acting on anything here.
Sources
- Required rate of return (RRR) — Investopedia
- Required rate of return — Corporate Finance Institute
- Choosing discount rates — Congressional Budget Office (CBO)
- Choosing a discount rate — MIT OpenCourseWare
FAQ
How Do You Calculate the Required Rate of Return?
Use CAPM (risk-free rate plus beta times the market risk premium) for individual stocks, WACC for corporate hurdle rates, or the dividend discount model's D1/P0 + g formula for stable dividend payers. Each method needs consistent nominal or real inputs to avoid skewed results.
Is a 4% Rate of Return Good?
It depends entirely on the risk you're taking.
What Counts as a Good IRR Over Five Years?
A good IRR needs to clear your RRR for that specific investment's risk level; there's no universal number since acceptable IRRs vary with sector, leverage, and market conditions. Compare the project's IRR directly against your calculated hurdle rate rather than a generic benchmark.
Is a 20% Rate of Return Good?
It's worth checking whether that return came with proportionally higher risk or volatility, since a high return alone doesn't confirm the investment was well priced for its risk.