
Return on invested capital (ROIC) is defined as the percentage return a company earns on all capital deployed in its operations, calculated as NOPAT divided by invested capital. ROIC is the single most direct measure of whether a business creates or destroys value. Warren Buffett, Charlie Munger, and Peter Lynch all built their frameworks around finding companies that consistently earn high returns on the capital they deploy. This guide explains how to calculate ROIC, how to interpret it, how it compares to ROE and ROA, and how to use it to find better stocks.
How to calculate return on invested capital
ROIC has two components: net operating profit after tax (NOPAT) and invested capital. Get both right, and the ratio tells you something genuinely useful. Get either wrong, and you are measuring noise.
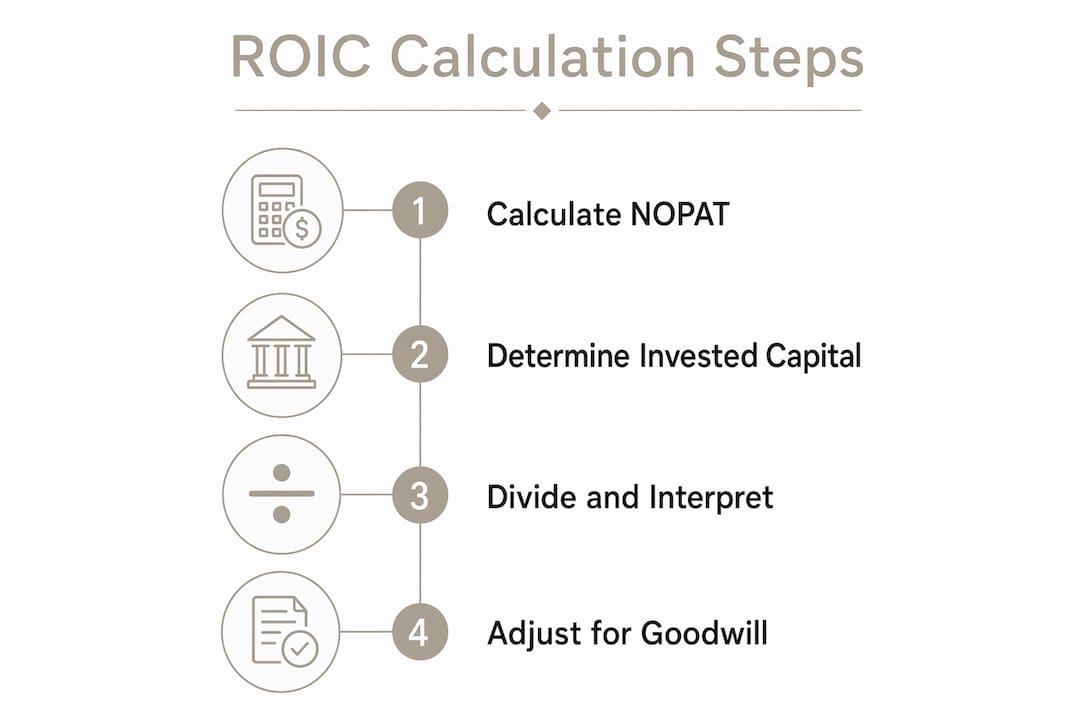
Step 1: Calculate NOPAT
NOPAT is operating income adjusted for taxes, with financing costs removed. The formula is: NOPAT = Operating Income × (1 − Tax Rate). Stripping out interest expense keeps the metric capital-structure neutral, so you can compare a debt-heavy manufacturer with a debt-free software firm on equal footing.

Step 2: Calculate invested capital
Invested capital equals net working capital plus property, plant, and equipment (PP&E), plus goodwill and intangibles. You can also arrive at the same number from the financing side: total debt plus total equity minus excess cash. Excess cash is subtracted because it sits idle, and does not contribute to operations.
Step 3: Divide and interpret
Divide NOPAT by invested capital. A 17.86% ROIC example means the company generated roughly 18 cents for every dollar invested. That is a clear, positive signal of value creation.
| Component | Formula | What it captures |
|---|---|---|
| NOPAT | Operating Income × (1 − Tax Rate) | After-tax operating profit, financing-neutral |
| Invested Capital (asset side) | Net Working Capital + PP&E + Goodwill | All operating assets deployed |
| Invested Capital (financing side) | Total Debt + Total Equity − Excess Cash | All capital providers' contributions |
| ROIC | NOPAT ÷ Invested Capital | Efficiency of capital deployment |
One nuance worth knowing: goodwill inclusion matters. Including goodwill in invested capital penalizes acquisitive companies but reveals the true all-in cost of acquisitions. Excluding goodwill shows underlying unit economics but can overstate efficiency. For comparing serial acquirers, always use the goodwill-inclusive version.
Pro Tip: Calculate ROIC both with and without goodwill for any company that has made significant acquisitions. A large gap between the two figures signals that the company paid steep premiums and may struggle to earn those premiums back.
What is a good ROIC?
The short answer: any ROIC above the company's weighted average cost of capital (WACC) signals value creation. ROIC exceeding WACC means the business earns more on its capital than it costs to fund that capital. Below WACC, the business destroys value even if it reports positive earnings.
The spread between ROIC and WACC is called economic profit. A company with a 14% ROIC and an 8% WACC generates a 6-percentage-point spread. That spread, multiplied by invested capital, is the dollar value being created for shareholders each year.
Industry benchmarks matter
ROIC varies significantly by industry. Tech companies often post ROICs of 20–30%, while capital-intensive utilities may only generate 6–9%. Comparing a software firm's ROIC to a utility's ROIC tells you nothing useful. Always benchmark within the same sector.
Here is a practical framework for reading ROIC values:
- Below WACC (typically below 8%): Value destruction. The company earns less than its cost of capital. Avoid unless there is a clear turnaround thesis.
- At WACC (roughly 8–12%): Value neutral. The business covers its capital costs but creates no surplus. Acceptable in capital-intensive industries with stable cash flows.
- Above WACC, moderate (12–15%): Value creation. The company earns a genuine return above its hurdle rate. Worth investigating further.
- Strong ROIC (15–30%+): Companies sustaining ROICs of 15–30%+ tend to have durable competitive advantages. This is the territory where compounding really works.
Pro Tip: Do not just check ROIC for one year. Pull five to ten years of data. A company that consistently earns 20%+ ROIC across economic cycles has a real moat. A company that hit 20% once during a boom year probably does not.
ROIC also has limits when viewed alone. High ROIC without growth opportunities limits compounding potential. A business earning 25% ROIC on $10 million of invested capital creates far less total value than one earning 20% ROIC on $1 billion of invested capital growing at 15% per year. The metric must be paired with reinvestment rate and growth prospects to tell the full story.
How does ROIC compare with ROE and ROA?
ROE (return on equity) measures net income divided by shareholders' equity. ROA (return on assets) measures net income divided by total assets. Both are useful, but both carry blind spots that ROIC avoids.
ROE is the most widely cited profitability metric, but it has a serious flaw. A company can boost ROE simply by taking on more debt, even if its underlying operations are not improving. ROIC is capital-structure neutral because it includes both debt and equity capital in the denominator and uses NOPAT rather than net income in the numerator. That makes ROIC a cleaner measure of operational quality.
ROA avoids the leverage distortion of ROE but includes non-operating assets like excess cash and short-term investments. Those assets drag down the ratio for cash-rich companies, making them look less efficient than they actually are. ROIC strips out excess cash, so the ratio reflects only the assets the business actually uses to generate profit.
Here is when to use each metric:
- Use ROIC when you want a capital-structure-neutral view of operational efficiency, especially for cross-company comparisons within an industry.
- Use ROE when you are specifically evaluating returns to equity holders and the company carries minimal debt.
- Use ROA when you want a broad, quick scan of asset productivity across a diversified portfolio.
For fundamental stock analysis, ROIC is the most reliable starting point. You can read a value rating to see how ROIC fits alongside other profitability signals in a structured scoring framework.
How can investors use ROIC for stock analysis?
ROIC becomes most powerful when you connect it to growth. The sustainable growth rate formula makes this explicit: Sustainable Growth Rate = ROIC × Reinvestment Rate. A company with a 20% ROIC that reinvests 50% of its earnings back into the business can sustain roughly 10% annual growth without taking on additional debt or diluting shareholders.
A practical four-step process for using ROIC in stock screening
- Screen for ROIC above 15%. This filters out capital-inefficient businesses and focuses your attention on companies with genuine competitive advantages. Most stock screeners allow you to set this as a minimum threshold.
- Check ROIC consistency over five to ten years. A single strong year means little. Consistent ROIC above 15% across a full business cycle signals a durable moat. Avoid companies where ROIC swings wildly year to year.
- Calculate the ROIC spread. Subtract the company's WACC from its ROIC. A spread above 5 percentage points is strong. A spread above 10 percentage points is exceptional and worth investigating for long-term compounding potential.
- Pair ROIC with free cash flow and reinvestment rate. ROIC must be evaluated alongside growth rates and free cash flow to assess long-term compounding potential. A high ROIC business that generates strong free cash flow and has room to reinvest at those same returns is the closest thing to a perfect investment.
Common pitfalls investors miss
Many investors make the mistake of treating ROIC as a standalone buy signal. A high ROIC today can reflect a temporary pricing advantage, a one-time cost reduction, or an accounting treatment that inflates operating income. Always ask why the ROIC is high and whether the conditions that produced it are likely to persist.
Another common error is ignoring the reinvestment opportunity. A mature business earning 25% ROIC but returning all capital to shareholders through buybacks is not compounding at 25%. It is compounding at whatever rate shareholders can redeploy that cash. The real compounding machine is a business that earns high ROIC and can reinvest large amounts at those same rates. Avoiding this mistake is one of the value investing lessons that separates experienced investors from beginners.
Pro Tip: When you find a company with ROIC above 20% and a reinvestment rate above 50%, model out the sustainable growth rate. If the implied growth rate matches or exceeds analyst consensus estimates, the market may be underpricing the compounding power of that business.
Key takeaways
ROIC above WACC is the clearest signal that a business creates value, and sustained ROIC of 15–30%+ combined with a high reinvestment rate defines the most powerful compounding machines in the stock market.
| Point | Details |
|---|---|
| Core formula | ROIC = NOPAT ÷ Invested Capital; always strip out excess cash and financing costs. |
| Value creation threshold | ROIC must exceed WACC to create value; the spread between the two is economic profit. |
| Industry context | Benchmark ROIC within sectors; tech firms often hit 20–30%, utilities typically 6–9%. |
| Growth connection | Sustainable Growth Rate = ROIC × Reinvestment Rate; high ROIC needs reinvestment to compound. |
| Metric comparison | ROIC is more reliable than ROE or ROA for cross-company analysis because it is capital-structure neutral. |
Why ROIC changed how I look at every stock
I spent years defaulting to ROE as my primary profitability check. It is the metric most financial media leads with, and it feels intuitive. Then I started digging into companies where ROE looked great but the balance sheet was quietly deteriorating. The leverage was doing the work, not the business.
Switching to ROIC as my primary screen changed what I noticed. Businesses that looked mediocre on ROE suddenly looked excellent when you removed the debt distortion. Others that looked strong on ROE revealed themselves as capital-destroying machines once you accounted for all the capital they had consumed.
The mistake I see most often is investors treating a single year of high ROIC as confirmation of a moat. A moat shows up in the consistency of ROIC over time, not in one exceptional year. I now look at ten-year ROIC trends before I look at anything else. If the trend is flat or declining, I move on regardless of how attractive the valuation looks.
The other thing I have learned: ROIC without a reinvestment story is just a nice number. The businesses that actually compound wealth are the ones that earn high ROIC and have large, visible opportunities to deploy more capital at those same rates. That combination is rare. When you find it, the valuation almost never looks cheap, but it is usually still worth paying for.
— Matt
Put ROIC to work with Oracleinvestments
Calculating and tracking ROIC across dozens of stocks manually takes hours. Oracleinvestments scores over 260 stocks on key financial fundamentals including profitability, valuation, and financial health, so you can assess capital efficiency without building spreadsheets from scratch.

The platform draws on the investment frameworks of Warren Buffett, Charlie Munger, and Peter Lynch, all of whom prioritized high ROIC businesses as the foundation of long-term wealth creation. Whether you are screening for companies with sustained ROIC above 15% or comparing two stocks side by side, Oracleinvestments puts the analysis in front of you in seconds. Invest like Buffett and start identifying high-quality businesses based on the metrics that actually matter.
FAQ
What is ROIC in simple terms?
ROIC measures how much profit a company generates for every dollar of capital invested in its operations. A higher ROIC means the business uses its capital more efficiently.
How do you calculate ROIC?
ROIC is calculated by dividing net operating profit after tax (NOPAT) by invested capital. Invested capital equals total debt plus total equity minus excess cash.
What ROIC is considered good?
Any ROIC above the company's WACC signals value creation. Companies sustaining ROICs of 15–30%+ typically have strong competitive advantages and durable economic moats.
How is ROIC different from ROE?
ROIC includes both debt and equity in the denominator and uses NOPAT instead of net income, making it capital-structure neutral. ROE only measures returns to equity holders and can be inflated by financial leverage.
Why does ROIC matter for long-term investing?
ROIC connects directly to compounding through the sustainable growth rate formula (ROIC × Reinvestment Rate). Businesses with high, consistent ROIC and strong reinvestment opportunities are the foundation of long-term value creation in any portfolio.