
EV to EBITDA is defined as Enterprise Value divided by Earnings Before Interest, Taxes, Depreciation, and Amortization. It tells you how much the market charges for each dollar of a company's core operating earnings. As of 2026, EV/EBITDA is the standard valuation multiple in investment banking for comparable company analysis across most industries. It strips out distortions from debt levels, tax rates, and accounting policies, giving analysts a cleaner basis for cross-company comparison than almost any other metric.
What is the EV to EBITDA ratio and why does it matter?
The EV/EBITDA ratio is an enterprise-value-based multiple, meaning it measures value from the perspective of all capital providers, not just shareholders. That distinction matters. A company can look cheap on a price-to-earnings basis simply because it carries heavy debt, which inflates interest expense and suppresses net income. The EV/EBITDA ratio removes that distortion entirely.
Enterprise Value and EBITDA align in what they represent, satisfying the matching principle that makes a valuation multiple valid. Enterprise Value captures the total value claimed by debt holders and equity holders combined. EBITDA approximates the cash available to all those capital providers before financing costs, taxes, and non-cash accounting charges. The numerator and denominator speak the same language.

Investment banks, private equity firms, and financial regulators treat this ratio as a foundational tool. It works across capital-intensive industries like manufacturing, energy, and telecom, where depreciation charges are large and would otherwise distort a P/E-based comparison. Understanding the EV/EBITDA ratio is not optional for serious valuation work. It is the starting point.
How is EV to EBITDA calculated?
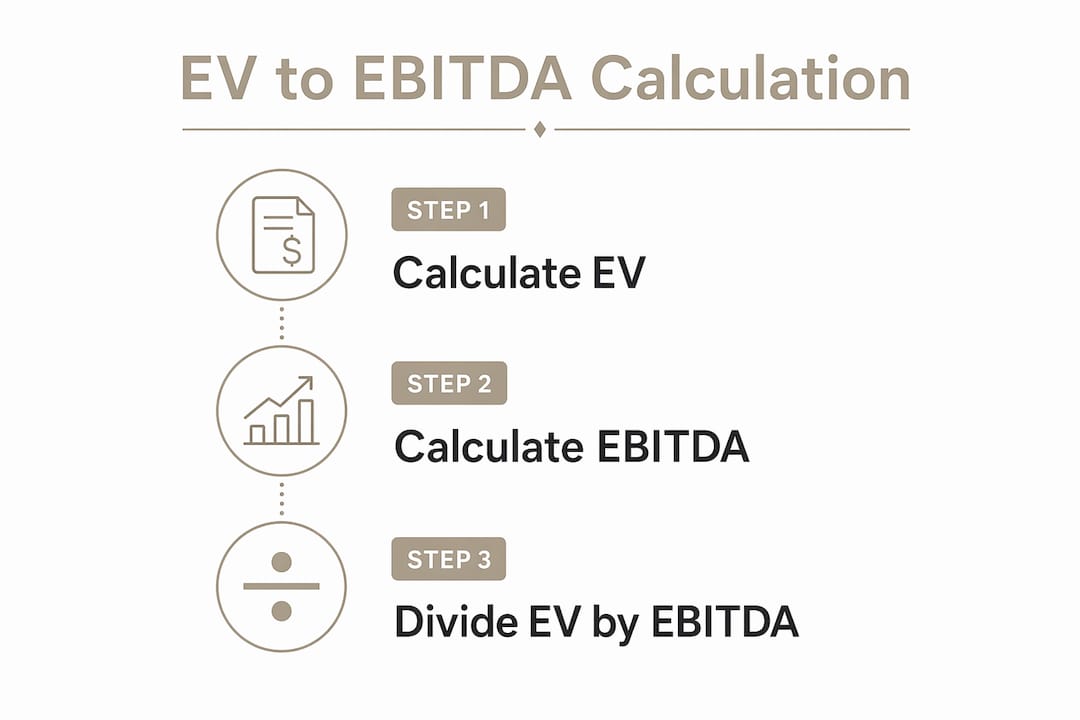
The formula has two parts. Each part requires careful construction before you divide one by the other.
Computing Enterprise Value
Enterprise Value equals Market Capitalization plus Total Debt minus Cash and Cash Equivalents. The EV formula accounts for the full cost of acquiring a business, including assuming its debt and receiving its cash. If a company has a $500 million market cap, $200 million in debt, and $50 million in cash, its Enterprise Value is $650 million.
Computing EBITDA
EBITDA equals Net Income plus Interest plus Taxes plus Depreciation plus Amortization. You are essentially reversing the accounting charges that sit between operating cash earnings and the bottom line. A company with $40 million in net income, $10 million in interest, $15 million in taxes, and $20 million in combined depreciation and amortization reports EBITDA of $85 million.
LTM vs. NTM approaches
Analysts use two time horizons. LTM stands for Last Twelve Months and uses historical results. NTM stands for Next Twelve Months and uses forward projections. NTM EV/EBITDA is preferred in investment banking because it reflects market expectations of future growth, not past performance. A company trading at 12x LTM but 8x NTM is pricing in significant earnings growth.
Normalizing EBITDA
Raw EBITDA from financial statements often needs adjustment. Normalization of EBITDA is mandatory for meaningful comparison. Analysts strip out one-time legal settlements, restructuring charges, and non-recurring gains. Stock-based compensation deserves special attention because it is a real cost to shareholders even though it is non-cash.
Pro Tip: Always request the bridge between reported EBITDA and adjusted EBITDA from management or the filing. If the adjustments are larger than 15% of reported EBITDA, treat the number with skepticism.
What are the advantages and limitations of EV/EBITDA?
Why analysts prefer it
The ratio's core strength is neutrality. EV/EBITDA eliminates distortions from three sources that make other multiples unreliable:
- Capital structure differences. A highly leveraged company and a debt-free company can be compared fairly because Enterprise Value captures both.
- Tax rate differences. Companies in different jurisdictions or with different tax histories show distorted net income. EBITDA sits above the tax line.
- Depreciation policy differences. Two companies with identical assets can report very different net income based on depreciation schedules. EBITDA adds it back.
This neutrality makes the ratio especially useful in capital-intensive industries like utilities, oil and gas, and industrials, where P/E ratios would mislead.
Where it falls short
The ratio has real blind spots. EV/EBITDA can flatter companies with large, ongoing capital expenditure requirements. When maintenance capex roughly equals depreciation, EBITDA overstates the actual cash the business generates. A steel mill reporting $300 million in EBITDA but spending $250 million annually just to maintain its equipment is not the same as a software company with the same EBITDA and minimal capex.
Working capital is another gap. A company can grow EBITDA while burning cash funding receivables and inventory. EV/EBITDA misses this entirely, but free cash flow analysis catches it immediately. Stock-based compensation is excluded from EBITDA, which dilutes shareholders without appearing in the ratio.
"Valuation multiples are shortcuts, not replacements for fundamental analysis. Understanding the drivers behind the numbers is essential for accurate valuation." — Morgan Stanley Investment Management
The practical implication: never use EV/EBITDA alone in capital-intensive or high-growth sectors. Pair it with free cash flow yield and return on invested capital to get the full picture.
How does EV/EBITDA compare to P/E and EV/Revenue?
Choosing the right multiple is a skill, not a formula. The selection of a valuation multiple requires analysis of profitability, normalization, and capital structure comparability. Each multiple serves a different purpose.
| Multiple | Basis | Best used when | Key weakness |
|---|---|---|---|
| EV/EBITDA | Enterprise value | Normalized profitability, cross-sector comparison | Ignores capex and working capital |
| P/E | Equity value | Stable capital structure, mature companies | Distorted by debt, taxes, and accounting |
| EV/Revenue | Enterprise value | Pre-profit or early-stage companies | Ignores cost structure entirely |
EV/EBITDA is preferred over P/E when leverage and tax structures vary widely across the peer group. P/E is equity-based and sensitive to capital structure. A company that has taken on significant debt will show a lower P/E simply because interest expense reduces net income, making it appear cheaper than it actually is.
EV/Revenue is the right choice when a company has no positive EBITDA yet. Early-stage technology companies or biotech firms in clinical trials cannot be valued on earnings. Revenue multiples provide at least a relative anchor, though they require careful judgment about margin potential.
Pro Tip: When comparing companies across borders, EV/EBITDA is almost always more reliable than P/E because it removes the noise from different national tax regimes and accounting standards.
The practical rule is to triangulate. Use EV/EBITDA as the primary multiple, cross-check with P/E for equity-level sanity, and use free cash flow yield to test whether the EBITDA is actually converting to cash.
How do investors apply EV/EBITDA in real-world analysis?
Comparable company analysis and precedent transactions
The two most common applications are comparable company analysis (comps) and precedent transaction analysis. In comps, you build a peer group of publicly traded companies, calculate each company's EV/EBITDA multiple, and use the range to value your target. In precedent transactions, you use multiples paid in past acquisitions, which typically carry a control premium of 20%–30% above public market multiples.
EV/EBITDA multiples vary widely across sectors due to differences in capital intensity, growth profiles, margins, and risk. There is no universal "good" multiple. A 6x multiple might signal deep value in a mature industrial business and a distressed situation in a high-growth software company trading at 25x.
Steps for applying the ratio correctly
- Build a clean peer group. Select companies with similar business models, geographies, and growth profiles. A diverse peer group produces a meaningless range.
- Normalize EBITDA for every company. Strip out one-time items, restructuring charges, and stock-based compensation consistently across the group.
- Use NTM estimates where available. Forward multiples are more relevant for investment decisions than historical ones.
- Check EBITDA quality. Confirm that EBITDA is converting to free cash flow. A company with strong EBITDA but negative free cash flow deserves a discount.
- Cross-reference with other multiples. Reconcile your EV/EBITDA-derived valuation with a P/E analysis and a discounted cash flow model.
Spotting aggressive accounting
Adjusted EBITDA disclosures are not standardized. Companies define "adjusted" differently, and some use it to exclude costs that are genuinely recurring. Watch for these red flags:
- Adjustments that recur every year but are labeled "one-time"
- Stock-based compensation excluded from adjusted EBITDA without separate disclosure
- EBITDA growing faster than revenue and gross profit simultaneously
- Large gaps between adjusted EBITDA and operating cash flow on the cash flow statement
Investors who avoid common valuation mistakes consistently check the cash flow statement against EBITDA claims before drawing conclusions.
Key Takeaways
The EV/EBITDA ratio is the most reliable starting point for cross-company valuation, but only when paired with free cash flow analysis and proper EBITDA normalization.
| Point | Details |
|---|---|
| Standard industry multiple | EV/EBITDA is the dominant multiple in investment banking for comparable company analysis. |
| Formula clarity | Enterprise Value equals Market Cap plus Debt minus Cash; EBITDA adds back interest, taxes, depreciation, and amortization to net income. |
| Normalization is mandatory | Adjust EBITDA for one-time items and stock-based compensation before any meaningful comparison. |
| Sector context required | No universal good multiple exists; interpret EV/EBITDA ranges within the specific industry and growth profile. |
| Always triangulate | Cross-check EV/EBITDA with P/E and free cash flow yield to avoid being misled by accounting choices. |
Why I think most investors misuse this ratio
After years of working through valuation models, the pattern I see most often is analysts treating EV/EBITDA as a verdict rather than a starting question. They find a company trading at 7x when peers trade at 12x and immediately call it cheap. That is the wrong instinct.
The first thing I do is ask why the discount exists. Low multiples often reflect low-quality EBITDA, not undervaluation. A company burning cash on capex while reporting strong EBITDA is not cheap at 7x. It may be expensive at 4x once you account for the real cost of maintaining its asset base. Understanding value drivers beyond the headline multiple is what separates disciplined investors from those who get burned.
The second mistake I see is ignoring the NTM versus LTM distinction. A company in the middle of a turnaround will look expensive on LTM and reasonable on NTM. The multiple you choose tells a completely different story depending on which earnings figure you use. Always state which time horizon you are using and why.
My honest view on 2026 market conditions: elevated interest rates have compressed multiples across capital-intensive sectors, which means historical benchmarks for "cheap" and "expensive" need recalibration. A sector that historically traded at 8x–10x may now fairly trade at 6x–8x because the cost of capital has risen. Applying old benchmarks to new conditions is a fast way to overpay.
The ratio is a tool. It is a good one. But valuation multiples are shortcuts, not substitutes for understanding the business behind the numbers.
— Matt
How Oracleinvestments makes valuation analysis faster
Applying EV/EBITDA correctly requires pulling data, normalizing EBITDA, building peer groups, and cross-checking multiple metrics at once. That process is time-consuming even for experienced analysts.

Oracleinvestments scores over 260 stocks across profitability, valuation, and financial health, giving you a structured view of where each company stands without building every model from scratch. The platform draws on the investment frameworks of Warren Buffett, Charlie Munger, and Peter Lynch, so the scoring reflects the kind of disciplined, fundamentals-first thinking that makes valuation multiples meaningful rather than misleading. If you want to put EV/EBITDA analysis into practice with real stocks, start with Oracleinvestments and see how the scoring system translates complex metrics into clear investment signals.
FAQ
What does EV to EBITDA tell an investor?
The EV/EBITDA ratio tells an investor how much the market pays for each dollar of a company's core operating earnings before financing, taxes, and non-cash charges. A lower ratio generally suggests a cheaper valuation relative to peers, though industry context is required for accurate interpretation.
What is a good EV/EBITDA multiple?
There is no universal good multiple. EV/EBITDA multiples vary widely by sector, with capital-intensive industries typically trading at lower multiples than high-growth technology companies. Always compare a company's multiple to its direct industry peers rather than a fixed benchmark.
How is EV/EBITDA different from P/E?
EV/EBITDA is an enterprise-value-based multiple that neutralizes differences in debt, taxes, and depreciation. P/E is equity-based and sensitive to capital structure, making it less reliable when comparing companies with different leverage levels.
When should I use EV/Revenue instead of EV/EBITDA?
Use EV/Revenue when a company has no positive EBITDA, such as early-stage or pre-profit businesses. Once a company reaches normalized profitability, EV/EBITDA becomes the more informative multiple.
Why do analysts normalize EBITDA before calculating the ratio?
Normalization removes one-time items and non-recurring charges that distort the true operating earnings of a business. Without normalization, the EV/EBITDA ratio reflects accounting noise rather than economic reality.