
The cash conversion cycle (CCC) measures how many days it takes a business to convert its investments in inventory and other resources into cash from sales. The formula is simple: CCC = DIO + DSO − DPO, where DIO is Days Inventory Outstanding, DSO is Days Sales Outstanding, and DPO is Days Payable Outstanding. According to J.P. Morgan, shortening the CCC reduces reliance on short-term financing and frees working capital for growth.
Two things to keep in mind before you go further:
- A shorter CCC generally improves liquidity. Every day you shave off means cash returns to the business faster.
- Sector context matters. A 45-day CCC might be excellent for a manufacturer and alarming for a grocery chain. Negative CCCs exist and can be strategic, but they carry hidden risks covered below.
Quick worked example: A manufacturer holds inventory for 50 days (DIO = 50), collects from customers in 35 days (DSO = 35), and pays suppliers in 40 days (DPO = 40). CCC = 50 + 35 − 40 = 45 days. That means the company funds 45 days of operations from its own cash before a single dollar of customer payment covers the cycle.
Key Takeaways
A shorter cash conversion cycle frees working capital, reduces short-term borrowing, and directly improves free cash flow — but only when the improvement comes from operational efficiency, not from stretching suppliers beyond agreed terms.
| Point | Details |
|---|---|
| CCC formula | CCC = DIO + DSO − DPO; lower values mean faster cash recovery from operations. |
| Days-to-dollars impact | A 20-day CCC reduction on $20M revenue frees roughly $1.1M in working capital. |
| Start with DSO | Invoice automation and collections fixes deliver the fastest, lowest-risk CCC gains. |
| Benchmark in context | Compare CCC to sector peers over 8–12 quarters; absolute values alone mislead. |
| Watch for distortions | Rising receivables faster than revenue growth signals potential revenue recognition risk. |
Table of Contents
- How do you calculate the cash conversion cycle?
- What does your CCC value actually tell you?
- How does the CCC translate into dollars of working capital?
- Practical tactics to cut DIO, DSO, and DPO
- What are realistic CCC benchmarks by industry?
- Accounting caveats and revenue recognition risks that distort CCC
- How to operationalize CCC tracking: KPIs, cadence, and ownership
- What finance leaders consistently underestimate about CCC programs
- Sources
How do you calculate the cash conversion cycle?
The three component formulas, sourced from Corporate Finance Institute, are:
- DIO = (Average Inventory ÷ Cost of Goods Sold) × 365
- DSO = (Average Accounts Receivable ÷ Revenue) × 365
- DPO = (Average Accounts Payable ÷ Cost of Goods Sold) × 365
Sourcing inputs from financial statements
Average inventory and average accounts receivable come from the balance sheet: add the opening and closing balances for the period, then divide by two. Cost of goods sold (COGS) and revenue come from the income statement. For annual analysis, use full-year figures. For quarterly monitoring, annualize by multiplying the quarterly COGS or revenue by four before dividing, so the day-count stays on a 365-day basis. A practical walkthrough of how to pull these line items from financial statements is available in the income statement analysis guide.
Annual figures smooth out seasonal spikes; quarterly figures catch emerging trends faster. Most FP&A teams run both.
Worked example
Assume a mid-size manufacturer reports the following for the fiscal year:
Applying the formulas from Wall Street Prep:
That 91-day cycle is typical for a manufacturer carrying significant raw materials and work-in-process. Whether it is acceptable depends entirely on what peers in the same sector are running.
What does your CCC value actually tell you?
A lower CCC is generally better for liquidity, but the composition of that number matters as much as the total. A company with a 30-day CCC built on 10-day DIO, 20-day DSO, and 0-day DPO is in a very different position than one achieving the same 30-day CCC by stretching payables to 90 days while carrying 80-day inventory and 40-day receivables.
Short CCC: two very different stories
Fast inventory turnover and prompt collections drive a genuinely lean CCC. That reflects operational strength. But a short CCC achieved primarily by pushing DPO to its limits can mask supplier stress. Vendors who feel squeezed eventually respond with tighter credit terms, price increases, or supply disruptions. The number looks good; the underlying relationships may not be.

Negative CCC: powerful but fragile
A negative CCC occurs when a company collects cash from customers before it pays suppliers. Subscription businesses and large e-commerce platforms sometimes achieve this. The appeal is obvious: customers fund operations. The risk, as noted in Wikipedia's CCC entry, is that over-reliance on stretched payables can mask supplier stress and create liquidity risk if customer payment behavior shifts. One bad quarter of slower collections can flip a negative CCC into a cash crunch with very little warning.
Trend and peer comparison beat absolute targets
Investopedia makes the point clearly: CCC must be compared to industry peers and tracked over time, because sector norms produce different benchmark ranges. A 90-day CCC for a heavy manufacturer may be competitive; the same number for a software-as-a-service business signals a serious collections problem.
Pro Tip: Track your CCC monthly and plot it against the prior 12 months alongside two or three peer companies. A rising CCC trend is often more informative than any single absolute value, and it surfaces problems before they hit the cash balance.
- Watch DIO separately from DSO. Rising inventory days and rising receivables days together suggest both operational and commercial stress.
- A sudden DPO spike without a corresponding supplier agreement is a red flag, not a win.
- Cross-check CCC against financial health indicators like the current ratio and quick ratio to get the full liquidity picture.
How does the CCC translate into dollars of working capital?
Days are useful for benchmarking. Dollars are what move executives to act. The conversion is straightforward: divide annual revenue by 365 to get daily revenue, then multiply by the number of CCC days to estimate the cash tied up in the cycle.
Using the worked example above ($24M revenue, 91.3-day CCC):
Working capital tied up = ($24,000,000 ÷ 365) × 91.3 ≈ $6.0 million
Now suppose the team cuts the CCC by 20 days through faster collections and tighter inventory. The User Solutions manufacturing guide illustrates this directly: a multi-week reduction on multi-million-dollar revenue frees a substantial amount of working capital, which can significantly improve liquidity and fund strategic initiatives. That cash can retire a revolving credit line, fund a capital project, or simply sit as a liquidity buffer.
The financing consequences compound from there:
- Lower short-term borrowing needs reduce interest expense directly.
- A tighter CCC improves the company's leverage ratios, which can unlock better credit terms from lenders.
- Self-funded growth becomes feasible without dilutive equity raises or expensive debt.
- Suppliers and customers both notice a financially stable counterparty and often offer better commercial terms in return.
The connection between CCC improvement and free cash flow is direct: every dollar freed from the working capital cycle flows through to free cash flow in the same period. For capital-intensive manufacturers, that link is often the most persuasive argument for investing in CCC programs.
Practical tactics to cut DIO, DSO, and DPO
Optimization requires working all three levers. The right mix depends on your industry, supplier relationships, and customer base. J.P. Morgan's treasury guidance frames it as a balancing act: reduce inventory days, accelerate receivables, and extend payables where appropriate without damaging the relationships that underpin the business.
Reducing DIO
Inventory is often the largest driver of CCC in manufacturing and wholesale. The levers:
- Demand forecasting improvements. Better forecast accuracy reduces safety stock requirements. Statistical forecasting tools integrated with ERP systems (SAP IBP, Oracle Demand Management) can cut forecast error meaningfully, which directly reduces average inventory.
- ABC/XYZ classification. Segment inventory by value (ABC) and demand variability (XYZ). High-value, predictable items get tight replenishment cycles; low-value, erratic items get reviewed for elimination or consignment.
- JIT and kanban. Pull-based replenishment reduces WIP and finished goods. The trade-off is supply chain fragility: a single supplier disruption can halt production. JIT works best with geographically close, financially stable suppliers.
- Slow-SKU liquidation. Dead stock ties up cash and warehouse space. A quarterly review that identifies SKUs with no movement in 90 days and routes them to clearance or return-to-vendor programs is one of the fastest DIO wins available.
Manufacturing scheduling choices have direct balance-sheet consequences, as the User Solutions guide notes. Plant managers who optimize for throughput often build WIP buffers that inflate DIO without realizing it. Translating WIP into "days of inventory" gives operations teams a KPI they can act on.
Lowering DSO
Billtrust's research documents that invoice and cash-application automation commonly reduces DSO materially, and that the improvement in AR accuracy supports better collections segmentation and fewer write-offs. The tactics:
- Invoice timing. Send invoices the day goods ship or services are delivered, not at month-end. A two-day delay in invoicing is a two-day delay in the payment clock.
- E-invoicing and payment portals. Electronic invoices with embedded payment links reduce friction and accelerate cash application. Platforms like Billtrust, Esker, and Corcentric automate matching and reduce manual errors.
- Early payment discounts. A 1%/10 net 30 term costs roughly 18% annualized, which is expensive for customers with cheap credit. Use selectively for large, slow-paying accounts where the DSO improvement justifies the discount cost.
- Credit policy tightening. Periodic credit reviews catch deteriorating customers before they become write-offs. A customer on 60-day terms who routinely pays at 90 days is a DSO problem and a credit risk simultaneously.
- Collections automation. Automated dunning sequences (reminder at day 5, escalation at day 15, hold at day 30) reduce the manual burden on AR staff and shorten average collection time.
Extending DPO
Stretching payables is the most immediately visible lever, but it carries the most relationship risk. Tactics that work without damaging suppliers:
- Negotiate longer standard terms upfront. Moving from net 30 to net 45 or net 60 at contract renewal is cleaner than unilaterally delaying payments.
- Dynamic discounting. Offer suppliers early payment at a discount when you have excess cash. The supplier gets liquidity; you capture a return on idle cash. Platforms like Taulia specialize in this.
- AP automation and payment timing. Centralized payables with automated approval workflows let treasury pay on the last day of terms consistently, rather than early by default (a common error in manual AP processes).
- Avoid over-stretching. Pushing DPO beyond agreed terms damages supplier trust, can trigger supply disruptions, and may violate contract terms. The risk is asymmetric: the DPO gain is incremental; a supply disruption can be catastrophic.
Tactic comparison
| Tactic | Primary lever | Typical timeline | Cost | Operational risk |
|---|---|---|---|---|
| Invoice automation (e.g., Billtrust, Esker) | DSO | a few months | Medium | Low |
| Early payment discounts | DSO | Immediate | Discount cost | Low |
| Dynamic discounting (e.g., Taulia) | DPO | a couple of months | Platform fee | Low–Medium |
| ABC/XYZ inventory classification | DIO | about a month | Low | Low |
| JIT/kanban replenishment | DIO | 6–18 months | Medium–High | High (supply risk) |
| Extended supplier payment terms | DPO | 1–6 months | Negotiation effort | Medium |
| Collections automation | DSO | a couple of months | Low–Medium | Low |
Pro Tip: Start with DSO. Collections process fixes and invoice automation deliver the fastest CCC improvements with the lowest operational risk, and the cash freed funds the longer-term inventory and procurement programs. Cross-functional alignment between sales (who set payment terms), AR (who collect), and treasury (who fund the gap) is the single biggest implementation barrier — assign a named owner before the project starts.
What are realistic CCC benchmarks by industry?
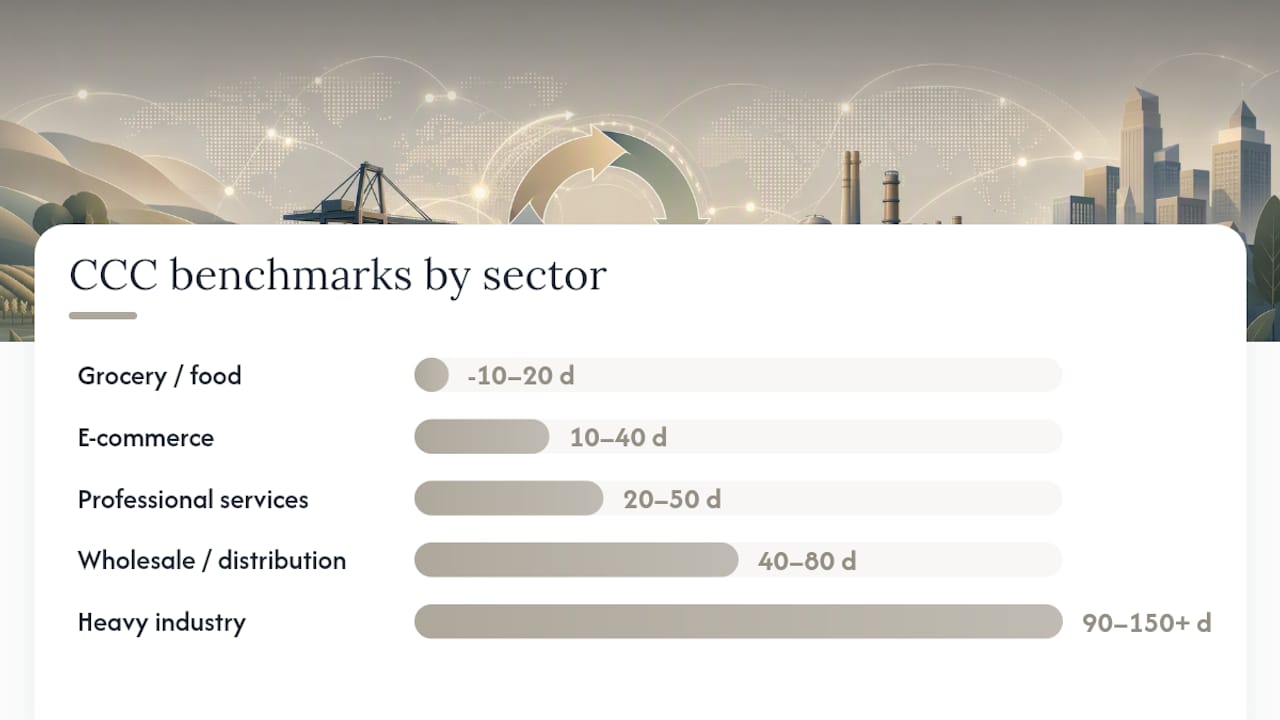
Benchmarks vary widely by sector because the underlying business models are structurally different. A grocery retailer turns inventory in days and collects cash at the point of sale; a capital equipment manufacturer may hold raw materials for months and extend 90-day terms to distributors.
The ranges below are illustrative, drawn from practitioner guidance and financial education resources. They are starting points for peer analysis, not hard targets.
| Sector | Illustrative CCC range | Key driver |
|---|---|---|
| Grocery / food retail | −10 to 20 days | Fast inventory turns, cash/card sales |
| E-commerce | 10–40 days | Low DSO, moderate DIO |
| General manufacturing | about two to four months | High DIO from raw materials and WIP |
| Wholesale / distribution | 40–80 days | Moderate DIO, trade credit DSO |
| Professional services | 20–50 days | No inventory, DSO-driven |
| Heavy industry / aerospace | 90–150+ days | Long production cycles, large WIP |
A few cautions before you use these ranges:
- Seasonality distorts point-in-time CCC. A retailer measured with peak inventory before the holiday season will show a much higher DIO than the same company measured in February.
- Business model differences within a sector matter. A manufacturer that sells direct has a different DSO profile than one that sells through distributors.
- Company size affects negotiating power on both payables and receivables terms.
The right target for your company is the peer median for your specific sub-sector, adjusted for your operational constraints, trended over 8–12 quarters. Setting a target of "match the best-in-class competitor" without accounting for their scale or business model is a common planning error.
Accounting caveats and revenue recognition risks that distort CCC
The CCC is only as reliable as the financial statements it comes from. Several accounting choices and practices can make the metric look better or worse than the underlying cash reality.
Key distortions to watch
- Revenue recognition timing. Recognizing revenue before cash is collected inflates DSO. Aggressive revenue recognition, including bill-and-hold arrangements and channel stuffing, can create an appearance of healthy revenue while actual cash collections lag significantly.
- Inventory valuation method. FIFO, LIFO, and weighted-average cost produce different COGS figures, which directly affect DIO and DPO calculations. A company switching from LIFO to FIFO will show a lower COGS and a higher DIO, even if physical inventory is unchanged.
- Seasonal distortions. Using year-end balance sheet figures for a highly seasonal business can produce a CCC that reflects the trough or peak of the cycle, not the operating average. Averaging monthly balances across the year gives a more accurate picture.
- One-off prepayments. A large customer prepayment at year-end compresses DSO artificially. A large supplier prepayment inflates DPO. Both distort the trend.
The earnings-management signal
Rising accounts receivable relative to revenue growth is one of the most reliable early warning signs of aggressive revenue recognition. SEC Staff Accounting Bulletin No. 101 addresses exactly this: practices like bill-and-hold and premature revenue recognition create an appearance of healthy revenue while cash collections lag. Auditors and analysts watch for this pattern specifically.
For analysts, the practical check is straightforward: compare the year-over-year change in accounts receivable to the year-over-year change in revenue. If receivables are growing at two or three times the rate of revenue, that warrants a closer look at the recognition policy and the disclosure notes. Spotting these signals in earnings calls is a skill covered in depth in the earnings call analysis guide.
When red flags appear, involve audit or compliance before drawing conclusions. The distortion may be benign (a large contract signed late in the quarter) or it may reflect a systemic recognition problem that requires restatement.
How to operationalize CCC tracking: KPIs, cadence, and ownership
Calculating CCC once a year for the annual report is not a management tool. The metric earns its keep when it is tracked regularly, owned by specific people, and connected to operational decisions.
Recommended KPIs
Track these alongside the headline CCC:
- DIO (and sub-components: raw materials days, WIP days, finished goods days for manufacturers)
- DSO (and Collection Effectiveness Index, which measures actual collections against the theoretical maximum)
- DPO (and on-time payment rate, to monitor supplier relationship health)
- Operating cycle (DIO + DSO, before the payables offset)
- Inventory turns (COGS ÷ average inventory, the inverse of DIO)
- Cash days at hand (cash and equivalents ÷ daily operating expenses)
Cadence
- Monthly: Full CCC and component recalculation for FP&A review. Flag any metric that moves more than 5 days month-over-month.
- Quarterly: Board-level reporting with trend charts and peer benchmarks. Tie CCC movement to working capital and free cash flow commentary.
- Weekly (exception basis): During high-growth periods, seasonal peaks, or financial stress, run a weekly AR aging and inventory snapshot. You do not need the full CCC calculation weekly; you need early warning signals.
Roles and ownership
| Function | Owns | Acts on |
|---|---|---|
| Treasury / FP&A | Headline CCC, working capital forecast | Financing decisions, target-setting |
| AR / Credit | DSO, Collection Effectiveness Index | Collections process, credit policy |
| AP | DPO, on-time payment rate | Payment timing, supplier terms |
| Plant / Operations | DIO (WIP and finished goods) | Scheduling, safety stock, slow-SKU review |
| Procurement | DIO (raw materials), DPO | Supplier terms, consignment arrangements |
Spreadsheet template structure
A minimal CCC tracking spreadsheet needs these columns, updated monthly:
| Column | Formula / source |
|---|---|
| Period | Month/Year |
| Average inventory ($) | (Opening + Closing) ÷ 2 from balance sheet |
| COGS ($) | Income statement |
| DIO (days) | (Avg inventory ÷ COGS) × 365 |
| Average AR ($) | (Opening + Closing) ÷ 2 from balance sheet |
| Revenue ($) | Income statement |
| DSO (days) | (Avg AR ÷ Revenue) × 365 |
| Average AP ($) | (Opening + Closing) ÷ 2 from balance sheet |
| DPO (days) | (Avg AP ÷ COGS) × 365 |
| CCC (days) | DIO + DSO − DPO |
| Working capital tied up ($) | (Revenue ÷ 365) × CCC |
The Amazon case study covered in HBR illustrates what enterprise-level CCC discipline looks like: tightly integrated operations, procurement, and treasury decisions that collectively produce a cash profile most companies cannot match. The lesson for smaller teams is not to replicate Amazon's scale but to replicate its cross-functional ownership model.
What finance leaders consistently underestimate about CCC programs
Most CCC improvement programs stall not because the math is wrong, but because the organizational model is wrong. Finance calculates the metric; operations, sales, and procurement control the levers. Without a named cross-functional owner and a governance structure that connects the KPIs to individual accountability, the numbers improve on slides and deteriorate in practice.
The sequencing that tends to work: start with DSO. Invoice automation and collections process fixes deliver cash within one to two quarters and require no capital investment. Use that freed cash to fund the inventory optimization work, which takes longer and requires buy-in from plant managers and procurement. Extend payables last, and only through negotiated terms, not unilateral delays.
The return on invested capital framework is a useful companion here: CCC improvements that free working capital without reducing revenue or margins translate directly into higher ROIC, which is the metric that ultimately drives equity value.
My priorities for a finance leader starting a CCC program this quarter:
- Quick wins (0–90 days): Audit invoice delivery timing, implement automated dunning, and run a slow-SKU liquidation review. These require minimal capital and deliver measurable DSO and DIO improvements fast.
- Medium-term (90–270 days): Implement demand forecasting improvements and ABC/XYZ inventory segmentation. Negotiate extended payment terms with top-10 suppliers.
- Governance (ongoing): Build the monthly CCC dashboard, assign component owners, and tie CCC targets to operating plan commitments. A metric without an owner is a decoration.
Sources
- Understanding & Optimizing Your Cash Conversion Cycle (CCC)
- The cash conversion cycle: A key metric for improving your company’s financial health
- Cash Conversion Cycle (CCC) - Investopedia
- Cash Conversion Cycle - Corporate Finance Institute (CFI)
- Cash conversion cycle - Wall Street Prep
- SEC Staff Accounting Bulletin No. 101 (SAB) - revenue recognition guidance
- At Amazon, it's all about cash flow - Harvard Business Review
- Cash Conversion Cycle for Manufacturers (User Solutions blog)
This article is general information, not a substitute for advice from a qualified financial advisor. Consult a qualified financial professional about your own circumstances before acting on anything here.