
TTM, or trailing twelve months, is the rolling 12-month summary of a company's most recent financial results. It matters because it gives you a current, seasonally balanced snapshot of performance instead of a stale fiscal-year number or a partial year-to-date figure. You calculate it by combining the latest fiscal-year data with year-to-date figures, or by simply adding the four most recent quarters.
TL;DR:
- TTM figures smooth out seasonal fluctuations, making them more reliable for analyzing companies with holiday-driven or cyclical sales patterns.
- Calculating TTM involves adding the latest four quarters or using the formula of latest fiscal year plus current YTD minus prior YTD, adjusted for restatements or one-off items.
- TTM ratios like P/E, EPS, and revenue are updated each quarter, providing real-time, comparable data for valuation and performance analysis.
- Using TTM instead of YTD captures a complete, seasonally balanced picture, especially advantageous when assessing recent performance before fiscal year-end.
- Be cautious of distortions from acquisitions, restatements, or one-time charges, and always verify TTM figures against underlying quarterly data to ensure accuracy.
Table of Contents
- What TTM Means and When You Should Use It
- How to Calculate TTM: Formula and Worked Example
- Common Metrics Reported on a TTM Basis
- TTM vs. YTD vs. NTM: Choosing the Right Window
- How Investors and Analysts Actually Use TTM
- Where TTM Can Mislead You
- Pulling the Numbers and Building TTM in a Spreadsheet
- How Oracle Investments Uses TTM in Stock Scoring
- Misconceptions Worth Killing Now
- A Faster Way to Track TTM-Based Signals
- Sources
What TTM Means and When You Should Use It
TTM (also called LTM, or last twelve months) refers to the most recent 12-month period ending on whatever date you're standing at today, rather than a fixed calendar or fiscal year. If a company's fiscal year ends in December but you're analyzing it in September, TTM pulls together the last four reported quarters, including the most recent one, to give you numbers current within the last few months.
The rolling window is the whole point. A single quarter can spike or sink for reasons that have nothing to do with a company's underlying health, such as a holiday shopping surge or a one-time tax charge. TTM smooths out those seasonal swings, which is why retailers, travel companies, and anything with a holiday-driven sales pattern get analyzed on a TTM basis far more often than on a raw quarterly basis.
Reporting frequency changes how you build the number:
- Public companies file 10-Qs quarterly, so summing four quarters is usually the cleanest approach.
- Private companies often report monthly, which means TTM calculation there requires accrual adjustments to line up cash timing with actual performance.
- Financial platforms recalculate TTM automatically each time a new quarter posts, so the number you see today already reflects the freshest quarter available.
That last point explains why TTM figures on a stock screener change every earnings season, even when nothing structural changed at the company. It's just the window sliding forward.
How to Calculate TTM: Formula and Worked Example
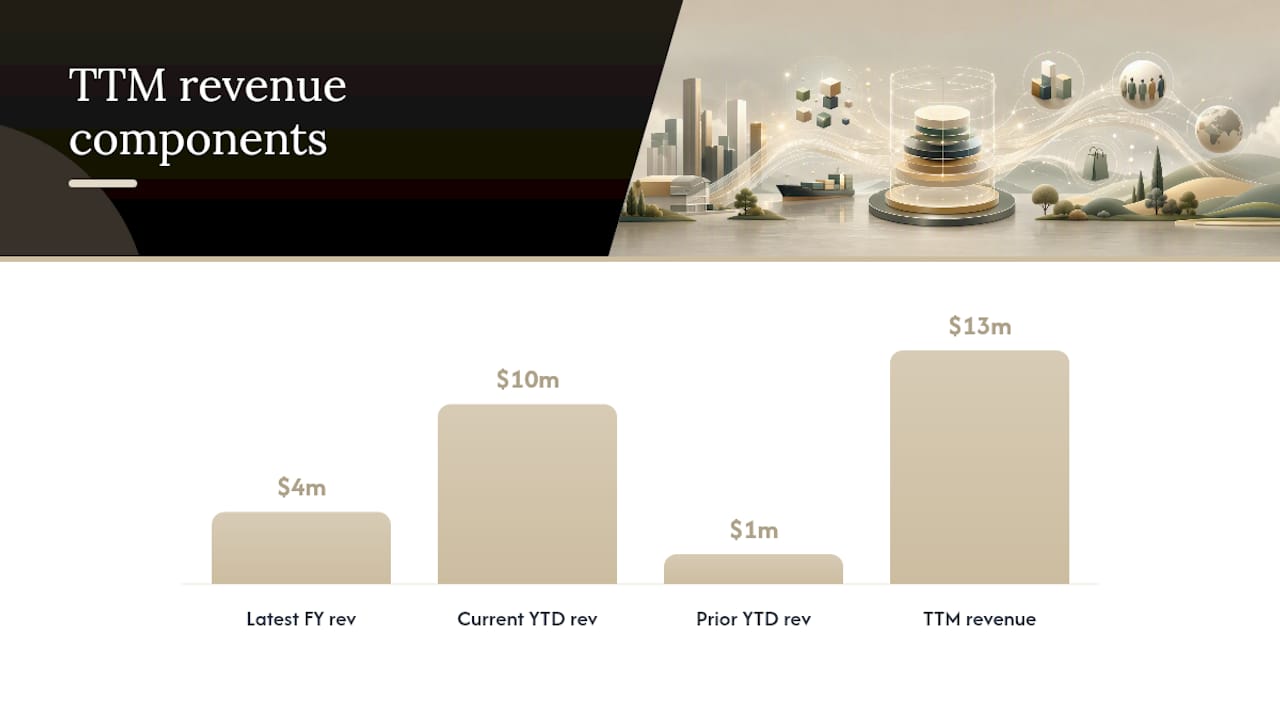
The standard formula is straightforward: TTM metric = Latest fiscal year metric + Current YTD metric − Prior-year YTD metric. This method is the one Xero's finance glossary and Corporate Finance Institute both point to as the standard approach, and it works because it replaces the overlapping stretch of last year's data with this year's fresher numbers.
There's a second method that's arguably more intuitive: just add the four most recent quarters. If you have quarterly filings handy, this avoids any subtraction errors entirely.
Here's how the formula method plays out with actual numbers, based on a company whose fiscal year ended with $4 million in revenue, followed by $10 million in the current year-to-date, against $1 million from the same year-to-date stretch last year:
| Component | Value |
|---|---|
| Latest fiscal year revenue | $4 million |
| Current YTD revenue | $10 million |
| Prior-year YTD revenue | $1 million |
| TTM revenue | $13 million |
That $4m + $10m − $1m = $13m calculation is the mechanical heart of TTM. Walk through it step by step for any metric, whether it's revenue or EPS:
- Pull the latest full fiscal-year figure for the metric you're calculating.
- Add the current year-to-date figure reported in the most recent quarterly filing.
- Subtract the year-to-date figure from the same point last year, since that's the stretch you're replacing.
- Repeat the identical three steps for EPS, using diluted EPS figures for consistency.
- Cross-check your result against a financial platform's published TTM number to catch input errors.
For EPS specifically, the four-quarter summation method tends to be more forgiving, since EPS figures are already per-share and don't require you to track shares outstanding across two different fiscal years.
Common Metrics Reported on a TTM Basis
Once you start looking, TTM shows up everywhere on a stock's data page. A few show up more than others:
- Revenue TTM tracks top-line momentum without the noise of a single strong or weak quarter.
- EPS TTM smooths out earnings volatility, which matters for companies with lumpy one-time gains or write-downs.
- EBITDA TTM and free cash flow TTM show operational performance over a stretch long enough to matter, which is why they anchor most EV to EBITDA valuation work.
- P/E (TTM) divides current share price by trailing twelve-month earnings, the default version of the ratio on most financial platforms and stock pages.
- Dividend yield (TTM) sums the last four quarterly payouts against the current share price, catching a dividend raise or cut faster than a static annual figure would.
Each of these differs from its trailing-year sibling in one subtle way: they update every quarter, so a company's TTM P/E today might look very different from its TTM P/E six months ago even if the share price barely moved, simply because a weak quarter rolled out of the window and a strong one rolled in.
TTM vs. YTD vs. NTM: Choosing the Right Window
These three abbreviations get confused constantly, and the mix-up leads to bad comparisons. YTD (year-to-date) measures performance from the start of the current fiscal year to now, so in February it might cover just six weeks. YTD is inherently shorter than TTM except at the very end of the fiscal year, when the two briefly converge.
NTM (next twelve months) flips the direction entirely: it's a forward-looking estimate built from analyst forecasts rather than reported actuals.
- Use TTM when you want a real, seasonally balanced measure of what actually happened, regardless of where the company sits in its fiscal calendar.
- Use YTD when you're tracking short-term progress against a budget or annual target within the current fiscal year.
- Use NTM when you're valuing a company on expected growth, since comparing TTM actuals against NTM forecasts reveals whether the market's optimism is backed by recent momentum or running ahead of it.
A retailer's Q4 YTD number six weeks into the new fiscal year tells you almost nothing useful. Its TTM revenue, capturing the full holiday quarter that just closed, tells you a great deal more.
How Investors and Analysts Actually Use TTM
TTM earns its keep in a handful of recurring investor workflows, not just as a definition you memorize once and forget.
Screening tools filter stocks by TTM revenue growth or TTM P/E because those numbers stay current without requiring the screener to wait for a full annual report. Peer comparisons lean on TTM even more heavily: comparing a retailer's fiscal Q2 against a competitor whose fiscal year runs on a different calendar only works cleanly when both are converted to the same trailing 12-month window.
- Smoothing seasonal swings to separate a genuine slowdown from a predictable seasonal dip.
- Feeding valuation multiples like P/E (TTM) and EV/EBITDA with current rather than stale inputs.
- Running due diligence checks that confirm a trend is durable across four quarters, not a one-off spike in a single reporting period.
- Setting screening thresholds, such as "TTM revenue growth above 15%" or "TTM free cash flow margin above 10%," to filter thousands of names down to a workable list.
Analysts pairing TTM actuals against NTM forecasts get an extra signal: a wide gap between the two often means either accelerating momentum or an analyst consensus that's gotten ahead of itself.
Where TTM Can Mislead You
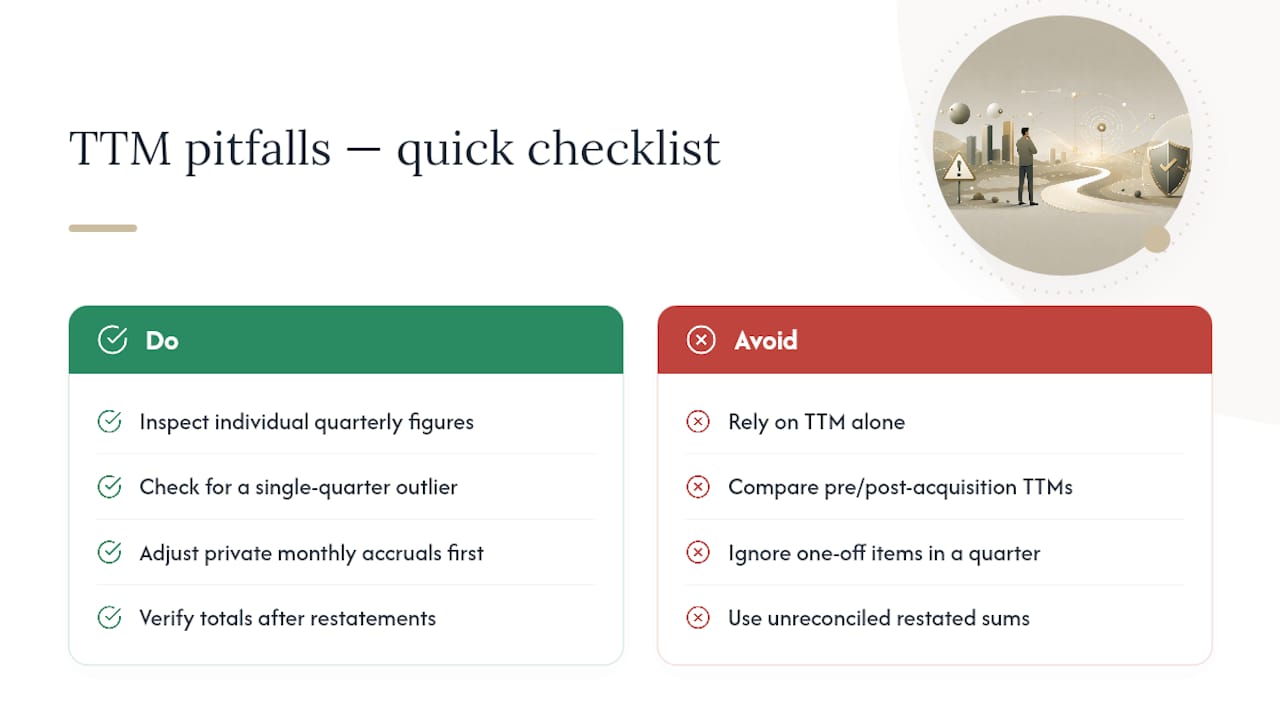
TTM is a rolling average, and averages hide things. A one-time asset sale, a legal settlement, or a restructuring charge sitting in just one of the four quarters will distort the entire trailing figure, even though it has nothing to do with ongoing operations. Mergers, acquisitions, and divestitures cause a similar problem: comparing a TTM figure from before an acquisition against one from after it is comparing two different companies wearing the same name.
Restatements compound the issue. If a company revises a prior quarter's numbers, your TTM sum may no longer match what the company itself now reports. Private-company data adds another layer, since monthly accrual-based figures need careful adjustment before they can be summed into a clean 12-month total.
Pro Tip: Before trusting any TTM figure, pull up the individual quarterly numbers behind it. If one quarter looks wildly out of line with the other three, that's usually a one-off item distorting your trailing average, not a genuine trend.
Pulling the Numbers and Building TTM in a Spreadsheet
Getting this right starts with the source data, not the formula. Here's the practical sequence:
- Pull the four most recent quarterly figures from the company's 10-Q and 10-K filings, or from investor relations pages for the exact line item you need.
- Set up a spreadsheet with columns for each of the last five quarters so you can subtract old quarters and add new ones as time passes.
- For the four-quarter method, use a simple
=SUM(B2:E2)formula across your four most recent quarterly cells. - For the fiscal+YTD method, structure it as
=LatestFiscalYear + CurrentYTD - PriorYearYTDreferencing the appropriate cells. - Reconcile your result against the TTM figure shown on a financial data platform to catch any timing mismatches.
- If the numbers don't match, check for restatements, fiscal year-end changes, or a one-time item that the platform has excluded but your raw filing hasn't.
Reading an income statement carefully before you start pays off here, since knowing exactly which lines to pull prevents the most common spreadsheet errors, like mixing up gross revenue with net revenue.
How Oracle Investments Uses TTM in Stock Scoring
TTM-derived ratios are exactly the kind of current, comparable inputs that a scoring system needs to stay accurate. Stock scores can be built across profitability, valuation, and financial health using metrics that update as new quarters post, so a TTM-based P/E or EPS figure feeding into a score reflects the last reported quarter rather than a fiscal year that might be nine months stale.
Real-time comparisons and watchlists can keep these TTM-based signals current, so you're comparing companies on the same rolling window rather than mismatched fiscal calendars. If you want to see how these inputs translate into an actual score, Oracle's guide to reading a value rating walks through the mechanics.
Misconceptions Worth Killing Now
The biggest mistake investors make with TTM is treating one strong quarter as proof of a trend, when it might just be one quarter rolling into the window and an old weak one rolling out. Ignoring one-off charges is the second most common error.
Three rules that hold up: check whether TTM growth matches the trend across all four underlying quarters, not just the newest one; verify a big TTM swing against the company's own disclosed one-time items; and never trust a TTM figure you can't reconcile to raw quarterly filings. Cross-checking against the quarterly trend catches almost every distortion before it costs you money.
— Matt
A Faster Way to Track TTM-Based Signals
Building TTM figures by hand in a spreadsheet works, but it's slow, and it's easy to miss a restatement or a one-off charge buried in a quarter you didn't scrutinize closely. There are apps built for investors who want those TTM-informed ratios (P/E, EPS, profitability, valuation) already calculated and updated as new quarters post, scored across many stocks so you can compare companies side by side without rebuilding the math yourself every time.

Some apps pair those scores with investment principles drawn from Warren Buffett, Charlie Munger, and Peter Lynch, so you're not just looking at a number, you're seeing it in context. If you'd rather spend your time deciding what to buy than reconciling quarterly filings, check out Oracle Investments and see how your current watchlist scores.
Sources
- Trailing twelve months (TTM) — Corporate Finance Institute
- TTM (trailing twelve months) — Xero glossary
- Trailing 12 months (TTM) — Investopedia