
Both XIRR and IRR calculate a money-weighted rate of return, but they handle timing differently: IRR assumes cash flows land at even intervals, while XIRR uses the actual calendar dates you give it. The rule of thumb is simple. If your contributions and withdrawals hit on irregular dates, which is nearly every real portfolio, use XIRR. Reserve IRR for clean, evenly spaced periodic models where the simplification doesn't cost you accuracy.
TL;DR:
- Use XIRR instead of IRR for portfolios with irregular cash flow dates to avoid inaccuracies caused by assuming even time intervals.
- XIRR discounts cash flows based on actual dates, making it more accurate for real-world scenarios like brokerage accounts or private equity investments.
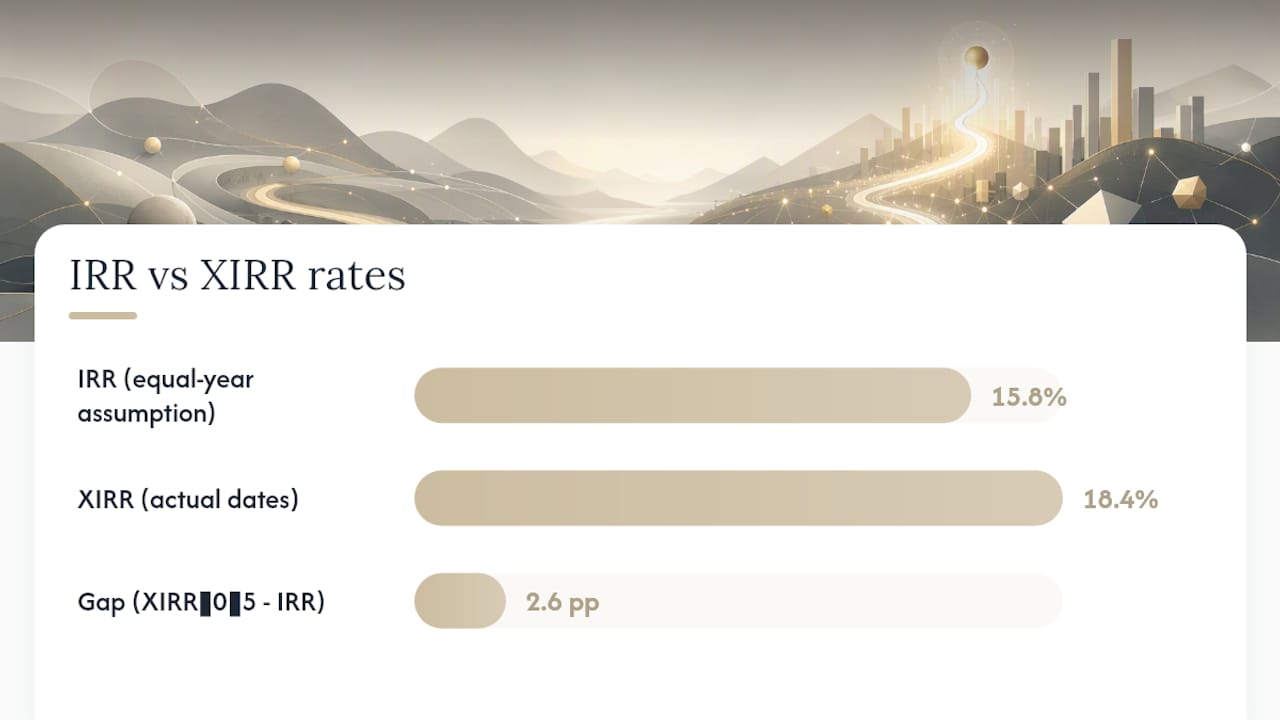
- The gap between IRR and XIRR can reach around 2.6 percentage points or more when cash flows occur closer together than assumed by IRR's even-spacing model.
- Always include a detailed cash-flow schedule next to your return calculation to ensure transparency and proper validation of results.
- In Excel, correct application requires matching signs for cash flows, proper date formatting, and choosing the right function to prevent errors like
#NUM!.
Table of Contents
- IRR vs XIRR: What IRR Actually Measures
- What XIRR Is and How It Handles Real Dates
- A Worked Example: IRR vs XIRR Side by Side
- When to Use Each One (and What Trips People Up)
- How to Calculate IRR and XIRR in Excel Without Hitting Errors
- What the Rate Actually Tells You About Your Returns
- Why We Default to XIRR When the Data Gets Messy
- Track Your Real Returns Without Rebuilding a Spreadsheet Every Time
- Sources
IRR vs XIRR: What IRR Actually Measures
IRR is the discount rate that makes the net present value of a series of cash flows equal to zero. In plain terms, it's the annualized return that reconciles what you put in with what you got back, assuming each period between cash flows is the same length.
The equation looks like this: NPV = Σ [CFt / (1 + IRR)^t] = 0, where CF0 is your initial outlay, CFt is each subsequent cash flow, and t is the period number, not the actual date.
That "period number" detail is where IRR gets rigid. It assumes equal spacing between cash flows, assumes reinvestment of interim proceeds at the IRR itself, and can produce multiple mathematically valid IRRs when cash flows flip sign more than once. IRR works well for structured models: fixed-schedule loan amortizations, project finance with quarterly draws, or textbook capital budgeting exercises where the periods really are uniform.

What XIRR Is and How It Handles Real Dates
XIRR solves the same underlying problem as IRR, an internal rate of return, but it plugs in actual calendar dates instead of assumed period counts. Technically, it's the rate that makes XNPV equal zero, discounting each cash flow by the exact number of days since the first one.
In Excel, the syntax is =XIRR(values, dates, [guess]). The function uses an iterative method to converge on a solution, and if it can't find a rate that satisfies the equation after enough tries, it throws a #NUM! error.
A few edge behaviors trip people up. The first value in your cash-flow array must be negative (your initial investment), or XIRR won't calculate correctly. Blank cells are ignored, but a zero is treated as an actual cash flow of zero, which is a meaningfully different thing in the calculation. Excel also assumes every date occurs at midnight, so intraday timing never factors in.
XIRR is the better choice any time contributions, distributions, or withdrawals happen on dates you didn't plan around a calendar: a brokerage account with irregular deposits, a private equity fund with capital calls, or a rental property with inconsistent income timing.
A Worked Example: IRR vs XIRR Side by Side
Here's a cash-flow schedule that shows exactly why the two numbers diverge. Say you invest $10,000 on January 15, then receive three payments back over the following year and a half:
- January 15, 2025: invest $10,000 (outflow)
- July 1, 2025: receive $2,000
- February 10, 2026: receive $4,000
- August 20, 2026: receive $7,500
If you feed those four cash flows into IRR while pretending each one lands exactly a year apart, you get roughly
. Run the same cash flows through XIRR using the real dates, and the rate jumps to around eighteen point four percent, a gap of roughly 2.6 percentage points on this schedule.The reason is compounding math. The July 2025 payment actually arrived less than six months in, not a full year, so your money was working for a shorter stretch than IRR assumed. XIRR credits that faster turnaround with a higher annualized rate. Corporate Finance Institute's own worked examples show this same pattern: the tighter the actual spacing deviates from the assumed periodic model, the wider the gap between the two results.
Small rounding differences can narrow the gap slightly depending on how you define "one period," but the direction of the divergence, faster returns pulling the rate up, holds regardless of rounding choices.
When to Use Each One (and What Trips People Up)
Use IRR when cash flows genuinely land on a fixed schedule, like a quarterly amortization table or a textbook capital budgeting problem with no real-world date data attached. Use XIRR for anything involving actual transaction dates, which describes most brokerage accounts, real estate deals, and private fund reporting.
The most common mistakes we see:
- Mixing periodicities within one IRR model, treating some gaps as months and others as years without adjusting the formula.
- Ignoring the reinvestment assumption baked into both metrics, which assumes interim proceeds get reinvested at the calculated rate itself, not at whatever your actual reinvestment rate turns out to be.
- Presenting a single rate number without showing the underlying cash-flow schedule, which makes the result impossible for anyone else to audit or reproduce.
When the reinvestment assumption feels unrealistic, MIRR lets you specify separate financing and reinvestment rates instead of forcing everything through one number. And if you're comparing a fund manager's skill rather than your own investor experience, time-weighted return (TWRR) strips out the effect of your deposit and withdrawal timing entirely.
Pro Tip: Always paste your cash-flow schedule into the model right next to the formula. A rate of return with no visible dates or amounts behind it is a number nobody, including you in six months, can trust.
How to Calculate IRR and XIRR in Excel Without Hitting Errors
The formulas themselves are short: =IRR(values, [guess]) for evenly spaced cash flows, and =XIRR(values, dates, [guess]) when you have actual dates. Pair XIRR with =XNPV(rate, values, dates) when you need the present value at a given rate rather than the solved rate itself, and reach for =MIRR(values, finance_rate, reinvest_rate) when the reinvestment assumption needs to be explicit.
Common errors and fixes:
#NUM!error: usually means the solver couldn't converge. Add a[guess]argument close to your expected rate, or check that your cash flows actually change sign at least once.- Wrong sign convention: outflows (investments) must be negative, inflows (returns) positive. A single misplaced sign throws off the entire calculation.
- Date formatting issues: XIRR needs real Excel date values, not text strings that look like dates.
- Blank vs. zero confusion: a blank cell is skipped; a zero is counted as a cash flow of zero dollars on that date.
Pro Tip: Lock your date and value ranges with named ranges before circulating a model. It stops a well-meaning colleague from inserting a row that quietly shifts one array out of alignment with the other.
What the Rate Actually Tells You About Your Returns
IRR and XIRR both measure the money-weighted rate of return (MWRR), which means they reflect your specific behavior as an investor, not just how well the underlying assets performed. MWRR weights the calculation by the size and timing of your cash flows, so a large deposit right before a rally inflates your rate, and a poorly timed withdrawal before a downturn can artificially improve it too.
That's fundamentally different from time-weighted return (TWRR), which strips out your deposit and withdrawal timing to isolate manager performance. If you're evaluating your own portfolio experience, MWRR via XIRR is the right lens. If you're comparing one fund manager against another regardless of when clients moved money in and out, TWRR is the fairer yardstick. Good reporting shows both, labeled clearly, so nobody mistakes one for the other.
Why We Default to XIRR When the Data Gets Messy
XIRR wins by default in nearly every real portfolio scenario, because irregular timing is the norm, not the exception. Nobody deposits money on a perfectly even schedule for years on end. The moment you round a 47 day gap into "roughly a month" to force an IRR calculation to work, you've introduced an error that XIRR simply doesn't require you to make.
At Oracle Investments, that principle shows up directly in how we think about surfacing return data: show the actual cash-flow dates, don't paper over irregular timing, and let the money-weighted number reflect what genuinely happened to the investor's capital. Whatever tool you use, the discipline that matters most is documenting your assumptions and running a sensitivity check before you trust the number on the screen.
— Matt
Track Your Real Returns Without Rebuilding a Spreadsheet Every Time
Running these calculations by hand works fine for one deal. It gets tedious fast once you're tracking a real portfolio with dozens of buys, sells, and dividend dates scattered across the year.

Some apps are built for investors who'd rather see their actual money-weighted return than re-derive it in a spreadsheet every quarter. Certain tools score a selection of stocks on profitability, valuation, and financial health, enabling you to compare holdings side by side without manually pulling fundamentals yourself.
- Portfolio tracking that accounts for contribution and withdrawal timing
- Side-by-side comparisons across stocks based on key fundamentals
- Incorporation of timeless investment principles into scoring
If you're tired of reconstructing cash-flow schedules by hand every time you want an honest read on performance, try the Oracle Investments app and see your holdings scored and compared in seconds.
This article is general information, not a substitute for advice from a qualified financial advisor. Consult a qualified financial professional about your own circumstances before acting on anything here.