
Portfolio drift is the gap between where your allocation actually sits and where you intended it to be. The single most useful thing you can do right now is pull up your current holdings, compare each asset class weight against your target, and flag anything outside your predefined bands.
Quick-start checklist:
- Record your target weights for each asset class (e.g., 60% equities, 40% bonds)
- Pull your current weights from your brokerage or aggregator
- Identify the largest overweights and underweights
- Pick your next step: redirect new contributions, execute tax-aware trades, or schedule a formal rebalance
Immediate action steps:
- Log into every account (not just one) and note current allocations
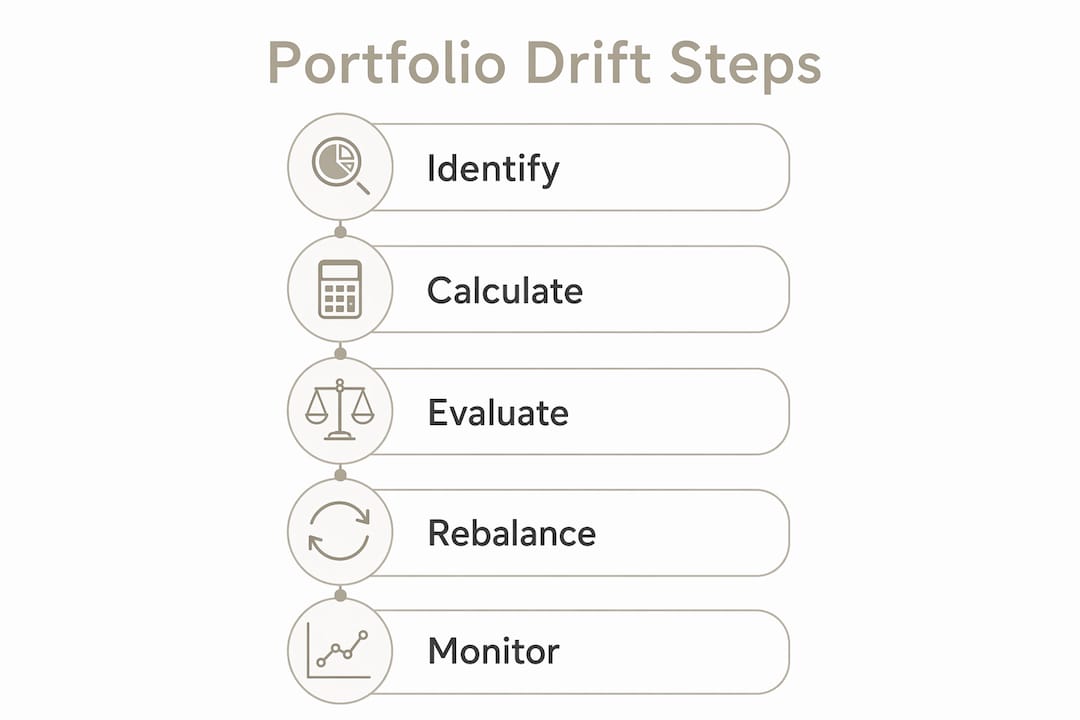
- Calculate the deviation for each asset class: current weight minus target weight
- Flag any class where the deviation exceeds your band (typically 5–10 percentage points)
- Decide whether to use cash flows, tax-loss harvesting, or direct trades to correct it
- Record your decision in writing, even if it is just a note
Oracleinvestments offers real-time portfolio tracking that surfaces allocation deviations as they develop, so you can catch drift before it compounds.
Table of Contents
- What does portfolio drift actually look like?
- Why unchecked drift puts your goals at risk
- How to calculate drift: the formula and a worked example
- When should you rebalance? Thresholds, frequency, and choosing a method
- How to execute a rebalance: a practical step-by-step
- How to monitor drift: tools, alerts, and a practical routine
- Tax and account type: how they change your rebalancing choices
- Common mistakes that undermine a rebalancing plan
- Key Takeaways
- The case for boring, documented rebalancing
- Oracleinvestments makes drift monitoring practical
- Useful sources and further reading
What does portfolio drift actually look like?
The clearest example is a bull equity market. Suppose you started 2020 with a 60/40 stock-bond split. By late 2021, without a single trade, that portfolio could have drifted to roughly 80% equities and 20% bonds, according to Vanguard's rebalancing research. You did nothing wrong. The market did it for you.

Drift shows up in several other patterns too. Bond outperformance during a flight to safety can push a growth-oriented portfolio toward an unintended conservative tilt. Dividend and interest income that accumulates as cash quietly builds a cash overweight. A single concentrated position, say a tech stock that triples, can dominate a portfolio that was once well-diversified.
One pattern that catches even experienced investors off guard is the household-level versus account-level mismatch. Your IRA might look perfectly balanced at 60/40, but your taxable brokerage is 90% equities. Aggregate the two and you are running 75% equities overall. Looking at accounts in isolation masks the real picture.
Not all drift is uncontrolled. Tax-loss harvesting, client-directed exceptions, or a deliberate tactical tilt are explainable deviations. The key distinction is whether the deviation was a conscious decision with a documented rationale, or something that just happened.
Why unchecked drift puts your goals at risk
The most direct consequence of drift is a change in risk exposure you never explicitly approved. A portfolio that drifts from 60% to 75% equities carries meaningfully higher volatility and drawdown potential. During a sharp correction, that extra equity exposure can translate into losses large enough to derail a retirement timeline or force a panic sale at the worst moment.
The practical risks of leaving drift unaddressed:
- Risk profile mismatch: Your portfolio becomes riskier (or more conservative) than your stated tolerance
- Goal misalignment: A retirement-focused portfolio drifting toward growth equities may not generate the income you need when you need it
- Behavioral risk: Investors who experience large drift-driven drawdowns are more likely to abandon their plan entirely, locking in losses
- Compliance exposure: For registered advisers, documented IPS review and supervisory sign-off are regulatory expectations, not optional best practices
Rebalancing reduces emotional decision-making and keeps portfolios aligned with stated objectives. That framing matters: rebalancing is not about predicting markets. It is about preserving the risk profile you agreed to.

How to calculate drift: the formula and a worked example
The standard formula is straightforward:
Drift (per asset class) = Current Weight (%) minus Target Weight (%)
A positive number means overweight; a negative number means underweight. Overall portfolio drift is typically expressed as the sum of absolute deviations across all asset classes, divided by two (to avoid double-counting).
Step-by-step worked example:
- Set your targets: 60% U.S. equities, 30% bonds, 10% international equities
- Check current weights after a strong equity run: 70% U.S. equities, 24% bonds, 6% international
- Calculate deviations: equities +10%, bonds -6%, international -4%
- Overall drift = (|+10| + |-6| + |-4|) / 2 = 10 percentage points
Industry guidance commonly sets review thresholds at 5–10 percentage points for major asset classes. For a 60% equity target, a 5% band triggers review at 55% or 65%, while a 10% band triggers review at 50% or 70%.
| Asset Class | Target Weight | Current Weight | Deviation | Threshold (5–10%) | Action |
|---|---|---|---|---|---|
| U.S. Equities | 60% | 70% | +10% | Breached | Trim |
| Bonds | 30% | 24% | -6% | Breached | Add |
| International | 10% | 6% | -4% | Within band | Monitor |
Threshold signal: A single asset class deviation of 10 percentage points in a 60/40 portfolio represents a material shift in risk exposure. At that level, the portfolio's expected volatility and drawdown profile no longer match the original plan.
The YCharts glossary defines drift consistently with this formula and notes that data providers use it as a standard measurement across portfolio analytics platforms.
When should you rebalance? Thresholds, frequency, and choosing a method
Three main approaches exist, and each involves real trade-offs.
Calendar-based rebalancing sets a fixed schedule, typically annual or quarterly, regardless of how much the portfolio has moved. It is simple, predictable, and easy to document. The downside is that you might rebalance when drift is minimal, incurring unnecessary transaction costs, or miss a large move between check-ins.
Threshold-based rebalancing triggers a trade only when an asset class breaches a predefined band. This keeps the portfolio tighter to its target but requires daily monitoring to be effective, which is impractical for most individual investors managing their own accounts.
Hybrid rebalancing combines both: review on a calendar schedule, trade only if a threshold is breached. This is the approach most financial planning literature recommends for individual investors, and it is what Fidelity's rebalancing guidance describes as a practical middle ground.
| Method | Monitoring Burden | Transaction Costs | Tracking Error | Best For |
|---|---|---|---|---|
| Calendar (annual) | Low | Low | Moderate | Most individual investors |
| Threshold-based | High (daily) | Low to moderate | Low | Institutional or automated accounts |
| Hybrid | Moderate | Low | Low to moderate | Advisers and engaged investors |
Vanguard's analytical research finds that annual rebalancing, sometimes paired with a 1–2% threshold, is optimal for investors who are not engaged in active tax-loss harvesting or tight benchmark tracking. The efficiency gain of annual over monthly rebalancing is driven 80–90% by market factors, not just cost savings.
Pro Tip: Document your chosen method, band width, and review cadence in an Investment Policy Statement before you need it. When markets are volatile and your portfolio is down 20%, you will not want to be deciding your rebalancing policy from scratch.
How to execute a rebalance: a practical step-by-step
Knowing when to rebalance is half the job. Executing it without unnecessary tax drag is the other half.
Step-by-step execution:
- Confirm current weights and target weights in writing
- Calculate the exact dollar amount to buy or sell in each asset class
- Check account type: is the trade happening in a taxable account, an IRA, or a 401(k)?
- Estimate the tax impact of any planned sales in taxable accounts
- Exhaust contribution-based options first before selling anything
- Execute trades in tax-advantaged accounts where possible
- Record every trade and the rationale in your IPS documentation
Prioritized rebalancing options:
- New contributions: Direct fresh cash toward underweighted asset classes. Using contributions restores target allocations without triggering taxable events.
- Dividend and interest reinvestment: Route income to underweighted positions rather than back to the same asset class
- Tax-loss harvesting: Sell losing positions in taxable accounts to offset gains from trimming winners
- Direct trades: Sell overweighted positions and buy underweighted ones; use tax-advantaged accounts first
- In-kind transfers: Where available, move securities between accounts to rebalance without a taxable sale
For professional investors managing client accounts, the execution checklist also needs a supervisory sign-off and a record of why any deviation from the IPS was approved.
How to monitor drift: tools, alerts, and a practical routine
Monitoring drift is not a once-a-year event. The right workflow catches problems early, before a 5% deviation becomes a 15% one.
Essential features to look for in a portfolio tracker:
- Cross-broker aggregation that shows your total household allocation, not just one account
- An allocation-vs.-target view that flags deviations in real time
- Threshold alerts that notify you when a specific asset class breaches your band
- Tax-aware suggestions that distinguish between taxable and tax-advantaged account trades
Cross-account aggregation is particularly important because it surfaces household-level drift that account-by-account reviews miss entirely.
Recommended monitoring cadence:
- Monthly light check: Scan allocation vs. target; no trades unless a threshold is clearly breached
- Quarterly review: Full allocation review, check for concentration risk and overlap
- Annual full review: Reassess target weights, update IPS, execute any planned rebalancing
- Ad-hoc check: Run immediately after any market move of 5% or more in a single session
FORVIS Mazars recommends reviewing after large market moves in addition to a set cadence, since volatility can push a portfolio through a threshold in days.
Oracleinvestments provides real-time portfolio syncing and an allocation view that shows current weights against your targets at a glance. The app's portfolio tracking features make it straightforward to set up a monitoring routine without building a spreadsheet from scratch.
Tax and account type: how they change your rebalancing choices
Where you rebalance matters almost as much as when. Selling a winning position in a taxable brokerage account creates a capital gains event. Doing the same trade inside a 401(k) or IRA has no immediate tax consequence.
The practical sequence most tax-aware investors follow: exhaust contribution-based rebalancing in taxable accounts first, then use tax-advantaged accounts for direct trades, and only sell winners in taxable accounts as a last resort or when the drift is severe enough to justify the tax cost.
Tax-loss harvesting adds another layer. If you hold a losing position in a taxable account, selling it to realize the loss can offset gains from trimming an overweighted winner. The net effect is a rebalancing trade with a reduced or zero tax bill. The wash-sale rule applies, so you cannot immediately repurchase the same security, but a similar (not identical) ETF or fund can maintain your exposure during the 30-day window.
ETFs generally have lower implicit transaction costs than mutual funds for rebalancing purposes because they trade intraday and do not trigger internal fund-level capital gains distributions. For investors holding both, ETFs are usually the better vehicle for executing rebalancing trades in taxable accounts.
Common mistakes that undermine a rebalancing plan
Most rebalancing failures are not analytical. They are behavioral or operational.
- Over-trading: Rebalancing every time a position moves 1–2% generates transaction costs and tax drag that erode returns faster than the drift itself
- Ignoring tax consequences: Selling winners in a taxable account without checking the tax impact first is one of the most common and costly errors
- No IPS documentation: Without a written policy, every rebalancing decision becomes a discretionary judgment call, which opens the door to emotional trading and, for advisers, regulatory exposure
- Account-level tunnel vision: Reviewing each account in isolation while ignoring household-level aggregation means drift can hide in plain sight
- Chasing recent performance: Letting a winning asset class run because it "feels like" it will keep going is market timing dressed up as patience. The common behavioral pitfalls that trip up value investors apply equally here
Key Takeaways
Portfolio drift requires a written policy, a consistent measurement formula, and a tax-aware execution sequence to manage effectively across both individual and professional accounts.
| Point | Details |
|---|---|
| Measure drift precisely | Use current weight minus target weight per asset class; flag any deviation beyond 5–10 percentage points for major asset classes. |
| Use contributions before selling | Directing new cash to underweighted positions avoids taxable events in brokerage accounts. |
| Document everything in an IPS | A written Investment Policy Statement with targets, bands, and cadence removes discretion and protects advisers. |
| Oracleinvestments for monitoring | Oracleinvestments provides real-time portfolio syncing and allocation views to catch drift before it breaches your threshold. |
The case for boring, documented rebalancing
Most investors treat rebalancing as a performance decision. It is not. It is a risk decision, and the distinction changes how you should think about it entirely.
When a portfolio drifts from 60% to 75% equities, the investor has effectively taken on more risk without making a conscious choice to do so. Correcting that is not about predicting whether equities will fall. It is about honoring the original agreement you made with yourself about how much risk you were willing to carry.
The investors who struggle most with drift are not the ones who lack the analytical tools. They are the ones who never wrote down a policy. Without a documented IPS, every rebalancing decision feels like a fresh judgment call, and fresh judgment calls in volatile markets tend to go badly. The discipline of a pre-written rule, even a simple one like "rebalance annually or when any asset class moves 10 points off target," removes the emotional variable from the equation.
For professional advisers, the stakes are higher. Persistent, undocumented drift is an examination issue. Regulators expect to see documented thresholds, periodic review records, and supervisory sign-off. The IPS is not paperwork for its own sake. It is the evidence trail that demonstrates suitability.
Simple, repeatable rules beat sophisticated ones you will not follow. Pick a cadence and a band that fits your actual bandwidth, write it down, and stick to it.
Oracleinvestments makes drift monitoring practical
Catching drift early is the whole game, and that requires a tool that aggregates your positions, shows you where you stand against your targets, and alerts you before a small deviation becomes a large one.

Oracleinvestments syncs your portfolio in real time and surfaces allocation deviations across your holdings, so you are not relying on a quarterly statement to find out your equity weight has drifted 12 points past your target. The app scores over 260 stocks on profitability, valuation, and financial health, which means you can assess whether the positions driving your drift are worth holding at their current weight or whether trimming makes sense on the fundamentals too. That combination of allocation monitoring and stock-level analysis is what separates a reactive rebalancing decision from a well-reasoned one.
Whether you are an individual investor building a disciplined routine or a professional managing client portfolios against a documented IPS, Oracleinvestments gives you the visibility to act on policy rather than instinct. Start tracking your portfolio today and see where your allocation actually stands.
This article is general information, not personalized investment or tax advice. Confirm current rules and thresholds with a qualified financial or tax professional for your specific situation.
Useful sources and further reading
| Resource | Description |
|---|---|
| Investor.gov — Is It Time to Rebalance? | SEC investor education on rebalancing frequency and goal alignment |
| Vanguard — Rebalancing Your Investments | Threshold guidance (5–10%) and practical rebalancing overview |
| Vanguard — Rational Rebalancing (PDF) | Analytical research on optimal rebalancing frequency and cost trade-offs |
| Fidelity — Rebalancing Your Investments | Calendar, threshold, and hybrid method comparisons with tax guidance |
| YCharts — Drift Definition and Formula | Concise formula reference for per-asset-class drift calculation |
| FORVIS Mazars — Allocation Drift | Review cadence guidance including post-volatility ad-hoc checks |
| Stratifi — Portfolio Drift Glossary | IPS documentation and compliance context for advisory firms |
| Oracleinvestments | Real-time portfolio tracking and stock analysis for drift monitoring |