
Return on capital employed measures how much operating profit a company generates for every dollar of capital it uses, calculated as EBIT (or NOPAT) divided by capital employed. Investors rely on it because it strips out financing effects and lets you compare a company's return directly against its cost of capital, or WACC. A quick screen: businesses posting a ROCE consistently above their cost of capital across several years and beating their industry peers tend to be the capital-efficient operators worth a closer look.
Key Takeaways
A company's ROCE is only meaningful when measured against its own cost of capital and its industry peers, not against an arbitrary universal benchmark.
| Point | Details |
|---|---|
| Core formula | ROCE equals NOPAT or EBIT divided by average capital employed, expressed as a percentage. |
| Compare to WACC | A ROCE consistently above the cost of capital signals genuine value creation over time. |
| Benchmark within industry | Capital intensity differs by sector, so only compare ROCE among direct peers. |
| Watch for distortions | Historical-cost depreciation, one-off items, and leverage can all skew ROCE without real operational change. |
| Track it with Oracleinvestments | The app surfaces ROCE and companion metrics like operating margin and cash flow directly in its stock scores and watchlists. |
Table of Contents
- What Does Return on Capital Employed Actually Measure?
- ROCE Formula and Component Choices: EBIT vs. NOPAT
- How Do You Calculate ROCE Step by Step?
- What Counts as a Good ROCE for Stocks?
- ROCE vs. ROIC, ROA, and ROE: Which Metric to Use When
- What Are the Common Pitfalls in Calculating ROCE?
- How Should Investors Act on a ROCE Number?
- Frequently Asked Questions
- Sources
What Does Return on Capital Employed Actually Measure?
ROCE measures operating profit per dollar of capital employed, where capital employed means total debt plus equity funding the business. It answers a specific question: how efficiently does management turn borrowed and owned capital into profit, before financing costs get involved?
Investors lean on this ratio for a few recurring jobs:
- Peer benchmarking — comparing capital efficiency across companies in the same industry
- Project review — checking whether a specific business line or investment clears its hurdle rate
- Long-term capital allocation — deciding whether a company deserves more capital or should shrink
Capital intensity varies wildly by sector, so a software company's ROCE and a steel producer's ROCE tell you different things unless you're comparing like with like.
ROCE Formula and Component Choices: EBIT vs. NOPAT
Two formulas dominate ROCE calculations, and the choice affects your result more than most investors realize.
- EBIT ÷ (Total Assets − Current Liabilities): the simpler version, using operating income straight off the income statement.
- NOPAT ÷ Average Capital Employed: the version Wall Street Prep recommends, where NOPAT equals EBIT × (1 minus the tax rate).
Capital employed itself has two equivalent paths: total assets minus current liabilities, or equity plus noncurrent liabilities. Both should land on the same number if a balance sheet balances.
NOPAT is the more rigorous numerator because it accounts for the tax shield companies get from operating income, not just raw EBIT. That's why serious financial models default to it over the simpler EBIT version.
Pro Tip: Averaging opening and closing capital employed (rather than using a single year end figure) smooths out month end borrowing spikes that can otherwise make ROCE look artificially strong or weak.
How Do You Calculate ROCE Step by Step?
Here's the reproducible process:
- Choose your period (typically a fiscal year).
- Pull EBIT from the income statement, or calculate NOPAT by multiplying EBIT by (1 minus the effective tax rate).
- Find capital employed at the start and end of the period from the balance sheet, then average the two.
- Divide operating profit by average capital employed and multiply by 100 to get a percentage.
A worked example makes this concrete. NOPAT comes to $180 million × 0.78, or $140.4 million. Capital employed was $900 million at the start of the year and $1.1 billion at year end.
$140.4 million divided by $1.0 billion gives a ROCE of 14.0%. Corporate Finance Institute's worked examples use this same averaging approach specifically to avoid the distortion a single balance-sheet snapshot can create.
What Counts as a Good ROCE for Stocks?
There's no universal cutoff for a "good" ROCE. What counts as strong in retail would look mediocre in software, and what looks strong in software would be a fantasy for a utility. The number only means something next to industry peers and the company's own historical trend.
The more useful heuristic ties ROCE to the cost of capital. If a company's ROCE consistently sits above its WACC, it's creating value for shareholders. If it sits below WACC, the business is destroying value even while it books positive net income, since it's not covering the true cost of the capital tied up in the business, according to AccountingTools.
- Compare ROCE against direct peers, not the broader market.
- Track ROCE across at least three to five years rather than judging one number.
- Treat a rising or stable trend as a stronger signal than a single strong year.
ROCE vs. ROIC, ROA, and ROE: Which Metric to Use When
These four ratios often get used interchangeably, which causes real analytical mistakes. Each has a different denominator and answers a slightly different question.
| Metric | Denominator | Best use case |
|---|---|---|
| ROCE | Debt + equity (capital employed) | Comparing capital efficiency, especially in capital-intensive sectors |
| ROIC | Invested capital (definitions vary by analyst) | Precise capital allocation analysis, often at the project level |
| ROA | Total assets | Quick efficiency check, useful for asset-heavy businesses like banks |
| ROE | Shareholder equity only | Judging returns to equity holders specifically, ignoring debt |
ROCE and ROIC are close cousins; the main difference is how each defines the capital base, and analysts sometimes use them almost interchangeably depending on house convention. ROA strips out the financing question entirely and just asks how well assets generate profit. ROE can flatter a highly leveraged company, since debt boosts equity returns without showing up as a cost in the ratio itself, which is exactly why capital-intensive industries lean on ROCE instead: it includes debt in its denominator and gives a fuller picture than ROE alone.
- Use ROCE or ROIC for capital-intensive sectors like manufacturing, energy, or telecom.
- Use ROE when you specifically care about shareholder returns and leverage effects.
- Use ROA for a quick, asset-focused efficiency check, particularly in financial services.
What Are the Common Pitfalls in Calculating ROCE?
ROCE has real blind spots, and missing them leads to bad calls.
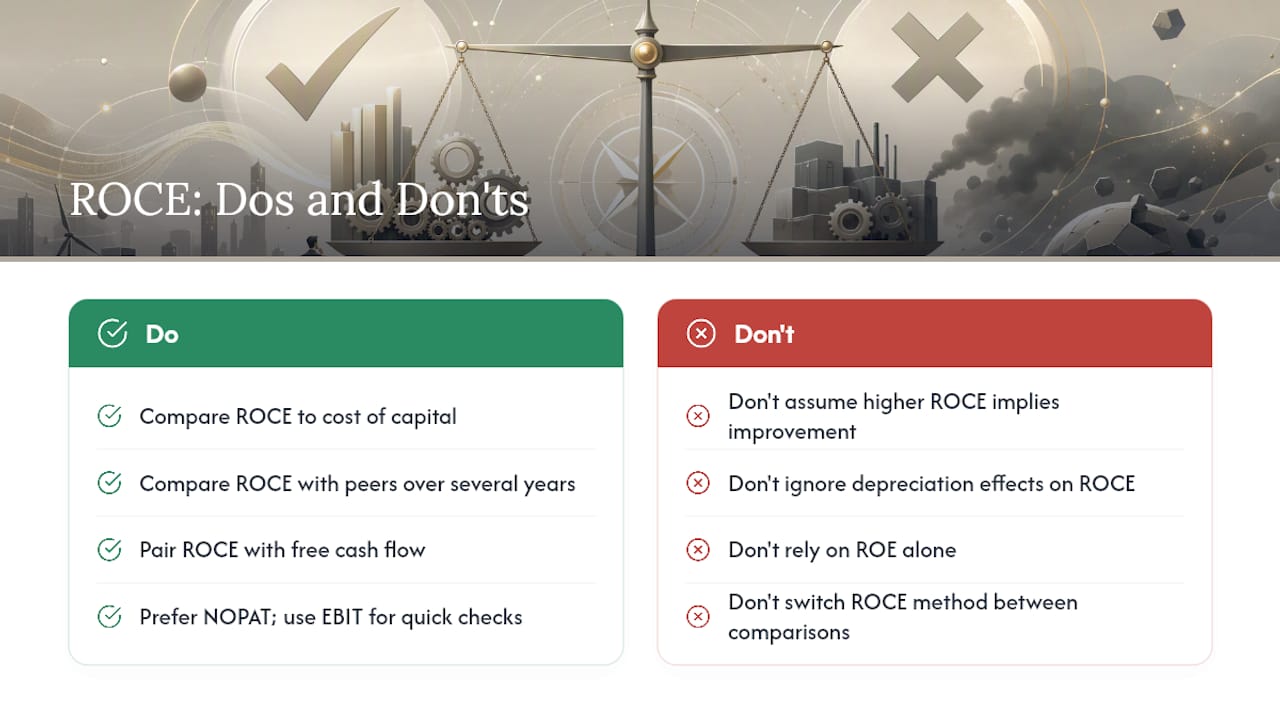
- Historical-cost distortion: aging assets get depreciated down over time, shrinking the denominator and inflating ROCE even when nothing operationally improved.
- One-off items: asset sales, impairments, or restructuring charges can spike or crater EBIT in a single year, making that year's ROCE meaningless in isolation.
- Leverage effects: heavily indebted companies can show unusual ROCE patterns depending on how interest and debt flow through the numerator and denominator.
- Inflation and replacement cost: because assets sit on the books at what they originally cost, an older asset base can understate what it would take to replace those assets today, quietly overstating ROCE.
Pro Tip: When a company's ROCE looks unusually high, check whether it's riding on old, mostly depreciated assets rather than genuine operating improvement, then cross-check with free cash flow to see if the profit is actually converting to cash.
Adjustments worth making: swap EBIT for NOPAT, strip out excess cash sitting idle on the balance sheet, and always look at free cash flow alongside ROCE rather than trusting the ratio in isolation.
How Should Investors Act on a ROCE Number?
For managers, the levers are straightforward: improve operating margins, sell off assets that aren't earning their keep, and tighten working capital so less cash sits idle in receivables and inventory.
For investors, run this checklist:
- Compare ROCE to the company's WACC, not just to an arbitrary round number.
- Look at three-plus years of ROCE, since AccountingTools recommends plotting the ratio over time rather than judging any single year.
- Confirm operating margin is stable, not just the headline ROCE figure.
- Cross-check with free cash flow to make sure profit is actually converting to cash.
Applying ROCE When Screening a Watchlist
A practical filter: keep companies whose ROCE has stayed above their peer median (or their own WACC) for at least three straight years. Pair that with operating margin stability and positive free cash flow to filter out companies where the ROCE number looks good but the cash isn't actually showing up. Oracleinvestments surfaces ROCE alongside these companion metrics directly in its stock scores, so you're not calculating any of this by hand.

Why ROCE Still Matters in a World of Fancier Models
ROCE survives because it does one job cleanly: it connects raw accounting figures to the return question that ultimately drives valuation. Newer factor models and machine-scored ratings are useful, but they rarely explain why a stock scores well the way ROCE does when you sit with the number and the balance sheet next to it. Treat it as a bridge, not a verdict. Pair it with free cash flow and a look at earnings quality before drawing conclusions.
Track ROCE Across Your Watchlist Without the Spreadsheet Work
Calculating ROCE by hand across a watchlist of even a dozen stocks means pulling EBIT, tax rates, and multi-year balance sheet data for every name, then rebuilding the same formula over and over. Oracleinvestments does that work upfront, scoring over 260 stocks on fundamentals including capital efficiency, so you see the number instead of building it.

Inside the app, you can screen companies by ROCE and related profitability measures, track how a company's ROCE trend moves across multiple years without re-pulling filings, and add flagged names straight to a portfolio watchlist for ongoing tracking. It leans on the same capital-efficiency thinking that guided investors like Warren Buffett toward businesses that compound capital well. Open the Oracle Investments app and run a free screen on your current watchlist to see where each holding stacks up on ROCE against its peers.
Frequently Asked Questions
What is a good ROCE for a stock? There's no fixed number that applies everywhere. A ROCE consistently above the company's cost of capital and its industry peers over several years is a more reliable indicator of strength.
Is a higher ROCE always better? Generally yes, but check why it's high. Old, heavily depreciated assets can inflate ROCE without any real improvement in operations, so pair the ratio with free cash flow before trusting it.
How is ROCE different from ROE? ROCE includes both debt and equity in its denominator, while ROE only looks at shareholder equity. That makes ROE more sensitive to leverage, since debt can boost equity returns without appearing as a direct cost in the ratio.
Should I use EBIT or NOPAT for ROCE? NOPAT is the more precise choice since it accounts for taxes, but EBIT is faster to calculate and works fine for quick comparisons. Stick to one method consistently when comparing companies over time.
This article is general information, not a substitute for advice from a qualified financial advisor. Consult a qualified financial professional about your own circumstances before acting on anything here.
Sources
- Return on capital employed — AccountingTools
- Return on Capital Employed (ROCE) | Formula + Calculator — Wall Street Prep
- Return on Capital Employed - Learn How to Calculate ROCE — Corporate Finance Institute