
Fundamental analysis follows a set order: understand the business, read the three financial statements, calculate the core ratios, check financial health, estimate intrinsic value with a DCF and relative multiples, then compare that value to the market price. The output is a written investment thesis with a bear/base/bull valuation range and a defined margin of safety. Every step below builds on the one before it, so skipping ahead to valuation without doing the groundwork is where most self-directed investors go wrong.
TL;DR:
- Most investors neglect to verify whether a company's cash flow and net income consistently align, which can reveal accounting issues or earnings quality concerns.
- Evaluating profitability ratios over a multi-year horizon and comparing them to industry norms provides better insight into a company's operational performance.
- Proper financial health assessment requires examining leverage, liquidity, and cash conversion metrics, not just profitability, to avoid funding risks during downturns.
- Using both discounted cash flow and relative multiples together helps identify valuation errors and ensures the market price aligns with intrinsic value estimates.
- Building a well-defined margin of safety based on intrinsic value and setting clear invalidation criteria prevents premature or risky investments.
Table of Contents
- Step 1: Understand the Business Model and Competitive Position
- Step 2: Read the Three Financial Statements and Cross-Check the Numbers
- Step 3: Evaluate Profitability and Efficiency With Core Ratios
- Step 4: Assess Financial Health and Cash Flow Quality
- Step 5: Estimate Intrinsic Value Using DCF and Relative Multiples
- Step 6: Compare Intrinsic Value to Market Price and Set a Margin of Safety
- Step 7: Analyze Management Quality and Capital Allocation
- Step 8: Add Industry and Macro Context to Test Assumptions
- Step 9: Synthesize Into a Concise Investment Thesis With Explicit Risks
- Step 10: Practical Checklist and Next Steps to Run the Analysis Efficiently
- Why a Repeatable Checklist Beats Ad-Hoc Research
- Get to a Thesis Faster With Oracle Investments
- Sources
- FAQ
Step 1: Understand the Business Model and Competitive Position
Before you open a spreadsheet, write one sentence describing how the company makes money: who pays it, for what, and how often. That single sentence forces clarity that ratios alone won't give you.
Then look for a moat. Real competitive advantages tend to fall into a few buckets:
- Network effects (the product gets better as more people use it)
- Cost advantages (scale, supply chain, or proprietary process)
- Brand strength that supports pricing power
- Switching costs that lock in customers
The 10-K's business section and Management's Discussion and Analysis (MD&A) usually spell out how management sees its own position, including named competitors and risk factors. A closer look at moat analysis can help you score these advantages more systematically instead of relying on gut feel.
Pro Tip: If you can't explain the business in one sentence to someone with no finance background, you're not ready to value it yet.
Step 2: Read the Three Financial Statements and Cross-Check the Numbers
Read filings in a specific order: income statement first, then the cash flow statement, then the balance sheet, with footnotes checked at each stop. The Fidelity learning center walks through how to find and use company financials this way, and it mirrors how most analysts actually work.
The critical cross-check happens between net income and operating cash flow. When they diverge sharply over several quarters, something is usually off, whether it's aggressive revenue recognition or a one-time gain propping up earnings.
- Reconcile net income to operating cash flow and flag any recurring "one-off" charges.
- Compute revenue growth over the last three to five years, not just the most recent quarter.
- Calculate operating margin and free cash flow directly from the statements.
Skip the investor slide deck at this stage. Investor makes the point plainly: presentations are marketing, and the audited 10-K is the primary source worth trusting.
Step 3: Evaluate Profitability and Efficiency With Core Ratios
Five ratios tell you most of what you need to know about how well a company converts sales into cash and how efficiently it deploys capital:
- Gross margin — pricing power and cost control at the product level
- Operating margin — efficiency after operating expenses
- Net margin — the bottom-line result after taxes and interest
- Return on equity (ROE) — profit generated per dollar of shareholder equity
- Return on invested capital (ROIC) — profit generated per dollar of total capital, debt included
A single quarter's ratio tells you almost nothing. What matters is the direction over five to ten years and how the numbers stack up against direct competitors in the same industry, since margin norms vary wildly between, say, software and industrial manufacturing. The profitability ratios guide breaks down how to normalize these comparisons across sectors.
Step 4: Assess Financial Health and Cash Flow Quality
Profitability means little if a company can't fund itself through a downturn. Leverage and liquidity checks catch that risk early:
- Net debt to EBITDA and interest coverage show how much debt the company carries relative to earnings and how easily it can service that debt.
- Current ratio and quick ratio measure whether short-term obligations are covered by liquid assets.
- Operating cash flow versus net income flags earnings quality; a persistent gap is a warning sign.
Statistic: Practitioner guidance built around real 10-K analysis recommends confirming cash conversion and comparing ROIC against WACC as a core evidence check, not an optional extra.
Watch the footnotes for off-balance-sheet obligations or a sudden accounting policy change. Those two items hide more risk than any single ratio. A deeper walkthrough of these mechanics lives in the financial health analysis guide.
Step 5: Estimate Intrinsic Value Using DCF and Relative Multiples
Two valuation methods, run side by side, catch errors that either one alone would miss. A discounted cash flow (DCF) model estimates absolute value; relative multiples check that estimate against what the market is actually paying for similar businesses.
- Build free cash flow projections, using conservative growth assumptions rather than extrapolating a hot year forward.
- Discount those cash flows using a defensible weighted average cost of capital (WACC).
- Cross-check the result against P/E and EV/EBITDA multiples, both versus sector medians and the company's own historical range.
- Run the same model three times: bear, base, and bull, changing growth and discount-rate assumptions each time.
Analysts who build financial models for a living generally insist on using at least two valuation methods and presenting a range rather than a single number, precisely because DCF outputs are extremely sensitive to small changes in assumptions.
Pro Tip: Move your discount rate by half a point in either direction and rerun the model. If your "buy" decision flips, your margin of safety wasn't big enough to begin with.
Step 6: Compare Intrinsic Value to Market Price and Set a Margin of Safety
Margin of safety is the gap between your base-case intrinsic value and the current market price, expressed as a percentage discount. A wide-moat, low-debt business might justify a moderate discount before you buy; a cyclical or highly leveraged company usually deserves a larger discount given the wider range of outcomes.
- Calculate margin of safety off your base case, not your bull case.
- Size the position to your conviction: a thin margin with real uncertainty warrants a smaller stake, if any.
- If the current price sits inside your bear-case range, wait. Forcing a purchase to feel productive is how good research turns into a bad trade.
Step 7: Analyze Management Quality and Capital Allocation
Numbers tell you what happened; management's decisions tell you what's likely to happen next. Capital allocation history is the fastest way to judge competence:
- Track ROIC trends over multiple years, alongside the timing of share buybacks (buying back stock when it's expensive is a red flag) and the consistency of dividend policy.
- Read the proxy statement for related-party transactions and how executive incentives are structured; incentives tied to per-share metrics tend to align better with shareholders than pure revenue targets.
- Watch insider buying and selling. Clusters of insider purchases, especially from multiple executives at once, often signal confidence that isn't yet priced in.
Step 8: Add Industry and Macro Context to Test Assumptions
Fundamental analysis works on three levels: the economy, the industry, and the company itself, and analysts move between top-down and bottom-up approaches depending on what they're trying to test.
- Monitor interest rates, inflation, and GDP growth mainly when the company is rate-sensitive (financials, real estate) or cyclical (industrials, consumer discretionary).
- Compare market share, growth rates, and margin gaps against direct peers to see whether the company is actually gaining ground or just riding a sector-wide tailwind.
- Flag regulatory or structural risks, like pending legislation or a shifting competitive landscape, that could invalidate an otherwise optimistic bull case.
Step 9: Synthesize Into a Concise Investment Thesis With Explicit Risks
Everything above exists to produce one paragraph you can defend out loud. A workable thesis template runs: the core claim, two or three supporting facts, and a time horizon.
- Write the thesis: "This company will compound value over the next three to five years because [moat], [financial strength], and [valuation gap]."
- List your top three risks in specific terms, not vague worry ("competition") but named threats ("a new entrant undercutting price by 20%").
- Set invalidation criteria: the exact data point (a margin drop, a failed product launch, a debt covenant breach) that would make you sell.
- Size the position according to conviction: high conviction with a wide margin of safety earns a larger allocation; a thin margin earns a small starter position or none at all.
A repeatable checklist like this one, built around evidence gathered directly from the 10-K, keeps you honest across dozens of stocks instead of reinventing the process each time.
Step 10: Practical Checklist and Next Steps to Run the Analysis Efficiently
Run through this on any stock, start to finish:
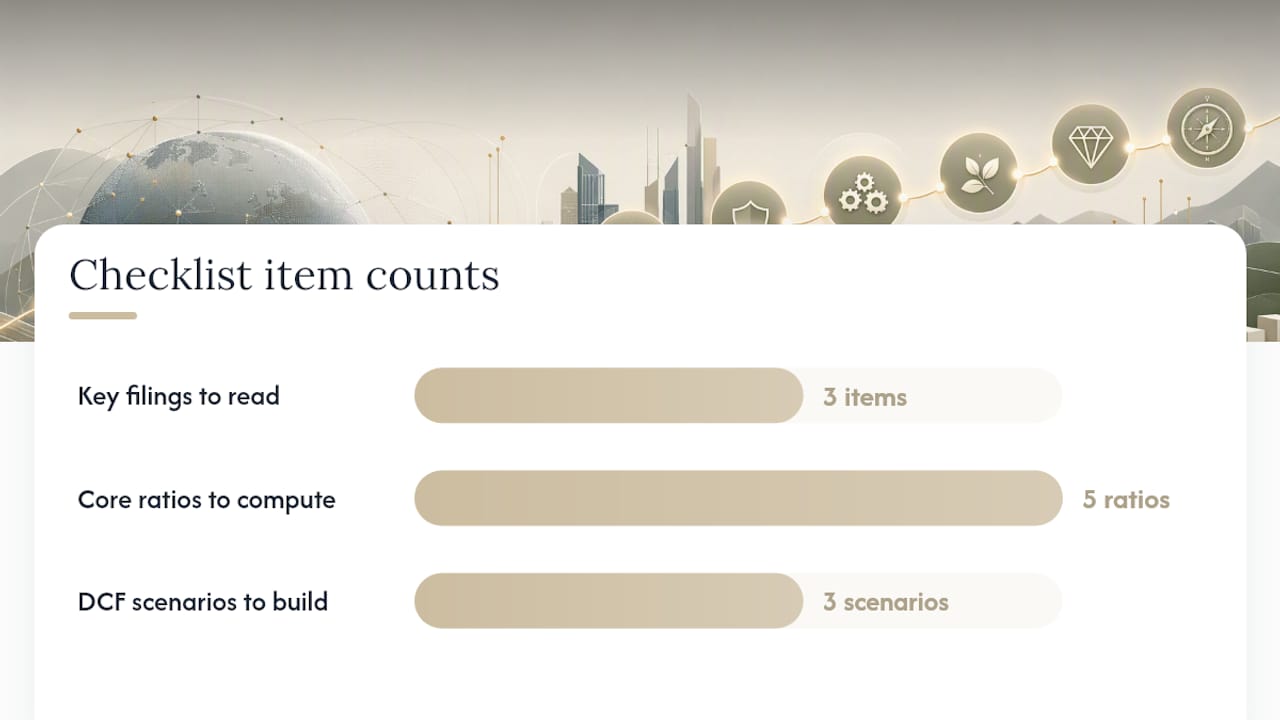
- Read the most recent 10-K and the last two 10-Qs.
- Compute the five core profitability and efficiency ratios.
- Check debt, liquidity, and cash conversion for red flags.
- Build a DCF with bear/base/bull scenarios and cross-check with relative multiples.
- Write the one-paragraph thesis with named risks and invalidation triggers.
Update ratios and cash flow checks every quarter after earnings; revisit the full thesis and valuation range annually or after a major event (an acquisition, a leadership change, a guidance cut). Oracle Investments' rule-based scoring mirrors this exact sequence, so reading a value rating is a fast way to see how a stock scores on these same fundamentals before you dig into the filings yourself.
Pro Tip: Keep a simple log of your thesis and invalidation criteria for every stock you own. Six months later, you'll know exactly why you bought, which is the only real defense against panic-selling.
Why a Repeatable Checklist Beats Ad-Hoc Research
Most investors don't fail at fundamental analysis because they lack intelligence. They fail because they research differently every time, chasing whatever ratio or headline caught their attention that week. A fixed sequence, business model, then statements, then ratios, then valuation, forces the same rigor onto every stock, which is what actually builds conviction over time.
Fundamental analysis is a framework for conviction, not a formula. The steps don't remove judgment; they organize it so your judgment has something solid to stand on. Tools that score companies on transparent, rule-based fundamentals, like Oracle Investments, don't replace this thinking. They speed up the repetitive parts, ratio pulls, historical comparisons, so you spend your time on the parts that actually require a brain: the moat, the management, and the thesis.
— Matt
Get to a Thesis Faster With Oracle Investments
Building the workflow above by hand, pulling ratios from filings, tracking historical ranges, comparing peers, takes real hours per stock. A Premium Annual subscription can apply that same rule-based, fundamentals-first logic automatically across many stocks, scoring profitability, valuation, and financial health so you can jump straight to the judgment calls: the moat, the management, the margin of safety.

Instead of rebuilding ratio tables every quarter, you get instant side-by-side comparisons and historical context on the same metrics covered in Steps 3 through 6 above, plus portfolio tracking that flags changes as new filings land. The scoring inputs stay visible, so nothing is a black box. If you want to see how a stock you're researching right now scores on these exact fundamentals, check the Premium Annual plan and pull up your first comparison.
Sources
Start with SEC EDGAR for primary filings, the Investopedia fundamental analysis entry for terminology, and Fidelity's learning center for statement-reading walkthroughs. Each is a solid starting point for verifying any claim in this guide.
This article is general information, not a substitute for advice from a qualified financial advisor. Consult a qualified financial professional about your own circumstances before acting on anything here.
FAQ
What Are the Five Steps of Fundamental Analysis?
A common version runs: analyze the business and its industry, examine the financial statements, calculate key ratios, estimate intrinsic value through models like a DCF, and compare that value to the market price to decide on action. Oracle Investments structures its scoring around this same sequence, condensed into a single comparable rating.
What Are the Three Layers of Fundamental Analysis?
The three layers are economic (macro conditions), industry (sector dynamics), and company (firm-level fundamentals), and analysts move between top-down and bottom-up approaches depending on the question they're answering. A full analysis usually touches all three before a thesis is finalized.
What Are the Four Pillars of Fundamental Analysis?
Definitions vary across sources, but a widely used version centers on profitability, financial health, valuation, and management quality, the four areas this guide walks through in Steps 3, 4, 6, and 7. Each pillar answers a different question: is the business good, is it stable, is it cheap, and is it run well.
What Are the Basics of Fundamental Analysis?
At its core, fundamental analysis means reading a company's income statement, balance sheet, and cash flow statement to judge its financial health, then estimating what the business is actually worth. That estimate gets compared to the current stock price to decide whether it's cheap, fair, or expensive.
How Is Fundamental Analysis Different From Technical Analysis?
Fundamental analysis studies the underlying business, earnings, debt, competitive position, to estimate what a stock is worth. Technical analysis studies price and volume charts to predict short-term price movement, without weighing in on whether the underlying company is actually a good business.