
A value trap is a stock that looks cheap on every standard multiple but keeps falling because the business itself is deteriorating. The fastest test is simple: check whether free cash flow and revenue are stable or growing. If both are shrinking, the low price isn't an opportunity. It's a warning.
TL;DR:
- A true value trap shows declining free cash flow and revenue over multiple years, indicating a structurally shrinking business rather than a temporary slump.
- Industry shifts such as print media or retail sector decline typically mean low multiples reflect permanent contraction, not undervaluation.
- Red flags include interest coverage below 2-3 times EBITDA, rising debt-to-EBITDA ratios, and dividend payouts exceeding free cash flow supply.
- Screening should combine valuation metrics with quality checks like stable free cash flow, ROIC above the cost of capital, and manageable debt levels.
- Recognizing a trap after purchase requires setting strict exit rules if key metrics deteriorate further, especially when catalysts for turnaround remain absent.
Table of Contents
- What Makes a Stock a Value Trap vs. Genuine Value
- Why Businesses Become Value Traps
- Red Flags and Financial Metrics That Expose Value Traps
- How to Screen for Value Traps Before You Buy
- Using a Fundamental Score to Speed Up the Screen
- What to Do Once You've Spotted a Value Trap
- What I've Learned Screening for Cheap Stocks
- How Oracle Investments Turns This Checklist Into a Faster Screen
- Sources
What Makes a Stock a Value Trap vs. Genuine Value
A cheap P/E or P/B ratio tells you what the market paid in the past, not what a business will earn going forward. That's the core problem with backwards-looking multiples: they measure yesterday's earnings against today's price, and say nothing about whether tomorrow's earnings will hold up. A value trap looks cheap across every standard valuation metric but keeps getting cheaper because the underlying business is structurally impaired, not just temporarily out of favor.
Certain industries breed value traps more than others. Print media, legacy retail, and traditional telecom have all seen decade-long "cheap" phases that never resolved because the entire sector was shrinking, not just one company within it. Coal miners and mall-based retailers trade at low multiples for the same reason.
Genuine value looks different. A temporarily depressed stock usually has stable or growing free cash flow, a clear reason the market overreacted (a bad quarter, a lawsuit, a sector-wide selloff), and a business model that still works. A trap has declining cash generation, a structural reason demand keeps falling, and no visible fix on the horizon. Same low multiple, opposite trajectory.
Why Businesses Become Value Traps
Most traps don't happen overnight. They build slowly through a handful of recurring failures.
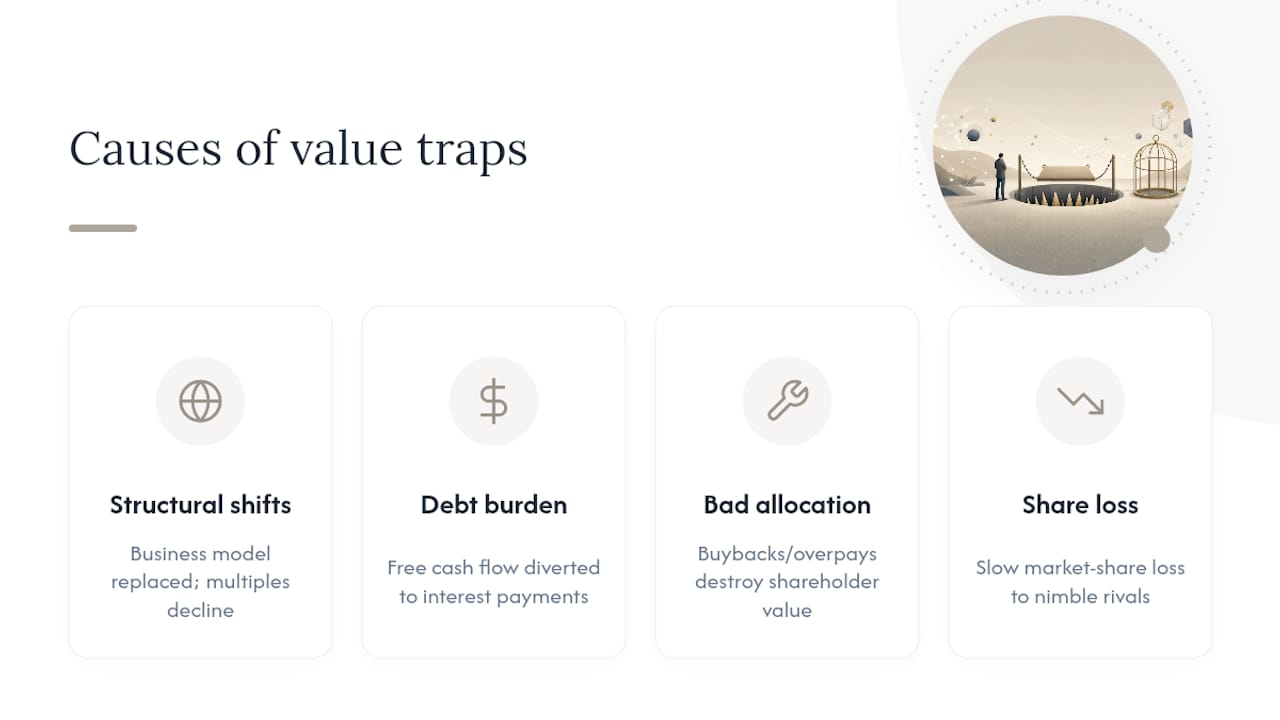
Structural industry shifts are the biggest culprit. When a business model gets replaced (physical video rental by streaming, print advertising by digital), no amount of cost cutting saves the multiple. The market prices in permanent decline, and it's usually right.
Debt compounds the problem. A company with a shrinking business and a heavy debt load has no room to invest its way out of trouble. Every dollar of free cash flow goes to interest payments instead of the fixes that might reverse the decline.
Bad capital allocation makes it worse. Management teams that buy back stock at inflated prices, overpay for acquisitions, or keep funding a legacy division well past its usefulness are destroying shareholder value in real time, even while headlines call the stock "undervalued."
Add in slow, steady market share loss to more nimble competitors and the accounting noise that often accompanies decline (one-time charges, asset write-downs, "adjusted" earnings that flatter the real picture), and you get a stock that looks statistically cheap for years while actually getting worse.
Red Flags and Financial Metrics That Expose Value Traps
The metrics matter more than the narrative. Here's what to check, in order of importance.
Free cash flow trend versus reported earnings. This is the single most important divergence to watch. A company can report positive net income for years while free cash flow quietly turns negative, because earnings include non-cash items and one-time gains that don't reflect actual cash coming in the door. When FCF and reported earnings diverge for more than a couple of quarters, trust the cash.
Revenue trend duration. One bad quarter is noise. Three or four consecutive years of declining revenue, especially if the rate of decline is accelerating rather than stabilizing, tells you the business itself is shrinking.
ROIC versus cost of capital. A company earning a return on invested capital below its cost of capital is destroying value with every dollar it reinvests, no matter how cheap the stock looks. Watch for margin erosion alongside this. It's usually the earliest sign of competitive pressure.
Debt-to-EBITDA and interest coverage. Practical red flags for value traps include declining margins, heavy debt, and dividend payouts unsupported by free cash flow. As a rough threshold, interest coverage below 2 to 3 times EBITDA is a serious concern, and debt-to-EBITDA climbing year over year signals a company losing its ability to service what it owes.
- Free cash flow declining for two or more consecutive years while earnings stay flat or positive
- Revenue falling for three-plus years with no sign of stabilizing
- ROIC persistently below the company's cost of capital
- Interest coverage under 2 to 3 times, or debt-to-EBITDA rising steadily
- Dividend payout ratio exceeding 100% of free cash flow
- Heavy insider selling or steady institutional exits despite a "cheap" headline multiple
A dividend yield that climbs mainly because the share price collapsed is one of the more deceptive signals in this list. It looks like income. It's often a warning that the payout itself is at risk.
How to Screen for Value Traps Before You Buy
Running a proper screen takes fifteen minutes and saves you from most bad decisions. Here's the sequence.
- Run your valuation filter first. Screen for low P/E, low P/B, or whatever cheapness metric you use. This just builds your candidate list. It tells you nothing about quality yet.
- Apply quality filters at the same time, not after. Screeners that pair valuation with quality filters like free cash flow, ROIC, and debt measures catch most value traps before you waste research time on a deeper dive. Look for stable or growing FCF, non-declining revenue, and ROIC above the cost of capital.
- Check debt and interest coverage. Flag anything with interest coverage under 2 to 3 times or debt-to-EBITDA trending upward for multiple years.
- Run the dividend sanity check. Compare the payout ratio to free cash flow, not net income. A dividend funded by new debt issuance rather than actual cash generation is a trap in slow motion.
- Look for a catalyst. A new management team, planned asset sales, a spinoff, or a genuine sector turn gives cheapness a path to resolve. Without one, low valuation multiples can remain dead money indefinitely.
If a candidate fails two or more of the quality checks, walk away regardless of how cheap it looks. If it passes the quality filters but you can't identify a catalyst, it's worth watching, not buying yet.
Pro Tip: Keep a simple spreadsheet with FCF trend, ROIC, debt-to-EBITDA, and payout ratio for every stock you're screening. Traps almost always fail at least two of these before the stock price ever tells you something's wrong.
Using a Fundamental Score to Speed Up the Screen
Running these checks manually across dozens of candidates is slow, which is exactly the gap Oracle Investments was built to close. The app scores more than 260 stocks on profitability, valuation, and financial health, folding the same free cash flow, ROIC, and debt checks covered above into a single comparable number.
A high score doesn't replace judgment, but it triages fast. Two stocks with identical P/E ratios can score very differently once quality and financial health enter the picture, which is often the first sign one of them is a trap. Use the score to read the fundamentals quickly, then go back to the manual checklist for any name that clears the bar and deserves a closer look before you commit money.
What to Do Once You've Spotted a Value Trap
Recognizing a trap after you've already bought in is a different problem than screening one out beforehand, and it calls for a different kind of discipline.
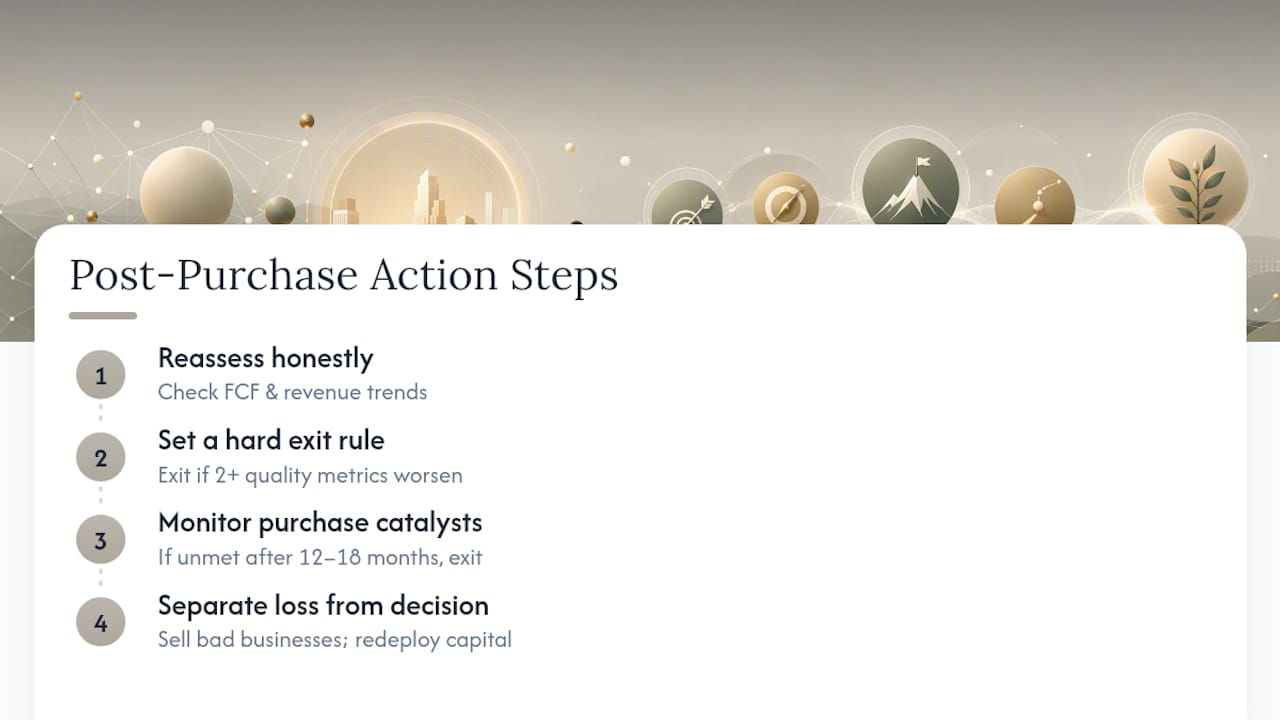
The first step is honest reassessment, not hope. If free cash flow has turned negative and revenue has declined for three-plus consecutive years, ask whether anything has genuinely changed since you bought the stock. If the answer is no, the "it's due for a bounce" instinct is usually just anchoring to your purchase price.
Set a hard rule before you're emotionally invested: if two or more quality metrics deteriorate further after you own the stock, that's an exit signal, not a reason to average down. Averaging down on a structurally declining business just increases your exposure to the same problem.
Watch for the catalysts you identified at purchase. If you bought expecting a turnaround, a new CEO, or an asset sale, and none of it materializes within the timeframe you set, that's information. A missing catalyst after twelve or eighteen months tells you the story you believed probably isn't playing out.
Finally, separate the loss from the decision. Selling at a loss feels like admitting failure, but holding a deteriorating business because you don't want to "lock in" the loss is a classic behavioral trap in its own right. The capital you free up by exiting can go toward a stock that actually meets your quality bar.
What I've Learned Screening for Cheap Stocks
Here's my rule of thumb: never buy cheap without healthy cash flow and a plausible catalyst. Skip either one and you're not investing, you're gambling on a story reversing itself.
The trap I see most often isn't ignorance of the metrics. It's anchoring. Investors watch a stock fall from $80 to $20 and convince themselves it's "on sale" simply because it used to trade higher, without asking whether the business at $80 still exists. Chasing a rising dividend yield falls into the same hole. The yield went up because the price collapsed, not because the company got more generous.
Protect your capital with tight screens before you fall in love with a story.
— Matt
How Oracle Investments Turns This Checklist Into a Faster Screen
Oracle Investments is the alternative to spreadsheet-building for investors who want the valuation-plus-quality approach in this article without building it from scratch every time. Instead of pulling free cash flow, ROIC, and debt-to-EBITDA figures one stock at a time, the app scores over 260 companies on profitability, valuation, and financial health side by side, so a candidate that clears your P/E filter but fails on cash flow shows up immediately, not after twenty minutes of digging.

The scoring model draws on the same investing principles behind Warren Buffett's and Peter Lynch's approach to quality-first value investing, translated into a number you can compare across your whole watchlist in seconds. Portfolio tracking lets you monitor the metrics that matter (FCF trend, debt coverage, dividend safety) as they change quarter to quarter, instead of only checking when you're worried. If you're ready to stop screening one stock at a time, start comparing companies on Oracle Investments and see which of your "cheap" candidates actually hold up.
Sources
For more on the concepts covered here, see Investopedia's guide to value traps, Research Affiliates on avoiding value traps, and Forbes on value investing versus cheap stocks. To go deeper on the mechanics, read Oracle's guide to free cash flow.
This article is general information, not a substitute for advice from a qualified financial advisor. Consult a qualified financial professional about your own circumstances before acting on anything here.
- How to Avoid Value Traps: Spot and Sidestep Risky ... — Investopedia
- Value Investing Vs. Cheap Stocks: How To Avoid A Value Trap — Forbes
- Investing