
Valuation metrics are standardized ratios, value divided by a financial or operating figure, that let you compare what the market pays against what a business actually produces. The single rule that saves you from bad conclusions: match the numerator to the denominator. Equity value pairs with equity-level metrics like earnings per share; enterprise value pairs with operating metrics like EBITDA or revenue. Get that pairing wrong and every comparison after it is noise.
TL;DR:
- Matching the numerator to the denominator is essential; equity value pairs with equity metrics like earnings per share, while enterprise value pairs with operating metrics such as EBITDA or revenue.
- When valuing unprofitable or early-stage companies, EV/Revenue or P/S are more relevant than P/E, which becomes meaningless without earnings.
- Cyclical industries require averaging earnings over full cycles or using normalized figures to avoid misleading valuations from peak or trough earnings.
- Sector-specific metrics like ARR for SaaS or FFO for REITs are more accurate than generic multiples when assessing value in specialized industries.
- Multiples are quick screening tools, but cash flow quality and management's capital allocation are key to confirming true business value.
Table of Contents
- Understanding Valuation Metrics: The Core Multiples
- Choosing the Right Metric: The Like-for-Like Rule
- Common Pitfalls and Caveats
- Worked Examples: What 10x EBITDA and $1,000,000 in Sales Actually Mean
- Practical Checklist: Apply Valuation Metrics in Under 10 Minutes
- How Oracle Investments Operationalizes Valuation Metrics
- Why Growth and Risk Are Baked Into Every Multiple
- Multiples vs. Discounted Cash Flow: Two Different Questions
- Adjusting Multiples for Cyclical Industries
- Sector-Specific Metrics Beyond the Core Multiples
- Valuation Metrics in M&A, Equity Research, and Investment Decisions
- Multiples Get You Close. Cash Flow Quality Gets You Right.
- Sources
- FAQ
Understanding Valuation Metrics: The Core Multiples
Every valuation multiple answers the same underlying question in a different currency: how much is the market charging for a dollar of profit, sales, or assets? The CFA Institute's framework draws a clean line between two numerators: equity value (market capitalization) and enterprise value (equity plus debt, minus cash). That distinction decides which denominator belongs underneath.
Here's how the standard toolkit breaks down:
- P/E (Price-to-Earnings): Share price divided by earnings per share, or market cap divided by net income. It answers "how many years of current profit am I paying for as a shareholder?" It's the most quoted multiple in financial media, and also the most sensitive to which earnings figure you use, trailing, forward, or adjusted.
- EV/EBITDA: Enterprise value divided by earnings before interest, taxes, depreciation, and amortization. Because it's a pre-debt measure, it's the go-to for comparing companies with different debt loads, since EV/EBITDA strips out financing decisions entirely.
- EV/Revenue: Enterprise value divided by sales. Useful when a company has no profit yet, common for early-stage or high-growth names, though it says nothing about margins.
- P/B (Price-to-Book): Market cap divided by shareholders' equity (book value). More relevant for banks and asset-heavy industries than for software companies.
- P/S (Price-to-Sales): Market cap divided by revenue. The equity-value cousin of EV/Revenue, and easy to misuse if you ignore debt levels.
- PEG (Price/Earnings-to-Growth): P/E divided by expected earnings growth rate. It adjusts the most-quoted multiple for the one thing it ignores: how fast the business is growing.
- P/CF (Price-to-Cash-Flow): Market cap divided by operating cash flow. A useful check when accounting earnings and cash generation diverge.
Nearly every multiple above comes in trailing and forward versions. Trailing (LTM, or last twelve months) uses reported, audited numbers, reliable, but occasionally distorted by one-time events. Forward multiples use analyst estimates, which are more relevant to where a company is headed but only as good as the forecast behind them, a trade-off Wall Street Prep's valuation guide flags as central to comps work.
Choosing the Right Metric: The Like-for-Like Rule
Picking a multiple isn't about finding the "best" one. It's about finding the one whose numerator and denominator describe the same slice of the business.
- Match the value claim to the metric. Equity value (market cap) belongs with equity-level numbers: EPS, net income, book value. Enterprise value belongs with pre-debt operating numbers: EBITDA, revenue, unlevered free cash flow. Macabacus's multiples guidance calls mixing the two the most common beginner error in comps work, and it inflates or deflates the multiple depending on how leveraged the company is.
- Swap in sector-specific denominators when core multiples go quiet. A subscription business is better judged on revenue per user or bookings growth than on P/E. A bank's book value matters more than its EBITDA, which barely exists as a concept there.
- Lean on EV/Revenue when there are no earnings to work with. Unprofitable or early-stage companies make P/E meaningless. Revenue is stickier and harder to manipulate, though you still need to check the margin story behind it.
Pro Tip: If a company's P/E looks unusually low, check whether it's an equity multiple sitting on top of a heavily indebted balance sheet before you call it "cheap." A quick EV/EBITDA cross-check often tells a very different story.
Common Pitfalls and Caveats
Headline multiples hide a lot. Trailing earnings often include one-off items, a legal settlement, an asset sale, a tax credit, that don't reflect the ongoing business, so clean the LTM figure before trusting it.
Growth, risk, and payout ratio all drive what a multiple "should" be. A company growing earnings at 20% deserves a higher P/E than one growing at 3%, all else equal, but the relationship isn't linear. As Aswath Damodaran's work on valuation multiples points out, doubling a company's growth rate rarely doubles its P/E.
Two more traps: mixing equity and enterprise denominators (covered above), and ignoring capital intensity. A capital-heavy manufacturer and an asset-light software company can carry the same EV/EBITDA and mean two completely different things about future cash generation.
Worked Examples: What 10x EBITDA and $1,000,000 in Sales Actually Mean
Numbers on a spreadsheet feel abstract until you run them through an actual deal logic.
- 10x EBITDA. If a company generates $2 million in EBITDA and trades at 10x, implied enterprise value is $20 million. Subtract net debt, say $4 million, and equity value comes out to $16 million. Before accepting that number, check EBITDA margins against peers, verify maintenance capital expenditure isn't understated, and confirm the multiple itself reflects comparable, similarly sized businesses.
- $1,000,000 in sales. With no meaningful profit yet, P/E is useless, so you shift to EV/Revenue or P/S. If peer companies in the sector trade at 2x to 4x revenue, a $1,000,000 sales business implies a rough valuation range of $2,000,000 to $4,000,000, before adjusting for growth rate, gross margin, and customer retention.
- Combine the number with the story. A multiple gives you a starting range. Whether the business deserves the high or low end depends on qualitative checks: customer concentration, competitive moat, and management's track record on capital allocation.
Practical Checklist: Apply Valuation Metrics in Under 10 Minutes
Run through this sequence any time you're sizing up a stock:
- Pick your numerator (equity value or enterprise value) and match the denominator accordingly.
- Decide trailing or forward, and note which one you're using so you don't compare apples to forecasts.
- Normalize earnings or cash flow: strip out one-offs, adjust for unusual tax rates or accounting changes.
- Benchmark against a real peer group, not the broader index.
- Adjust for growth and risk differences between the company and its peers.
- Flag any data-quality issue, restated financials, recent M&A, currency swings, before trusting the output.
Pro Tip: Keep a running peer-comp sheet for the three or four companies you follow most closely. Refreshing it takes minutes and turns "is this cheap?" into a five-second glance instead of a fresh research project every time.
How Oracle Investments Operationalizes Valuation Metrics
Running this checklist by hand across a watchlist gets tedious fast. Some investment apps score stocks on valuation, profitability, and financial health, turning peer-benchmarking into an instant side-by-side comparison instead of a spreadsheet project. Portfolio tracking features can show how multiples shift as prices move, not just at quarter-end. Educational content often ties these mechanics back to investing principles used by legendary investors like Warren Buffett, Charlie Munger, and Peter Lynch.
Why Growth and Risk Are Baked Into Every Multiple
A multiple is never just a price tag. It's a compressed forecast. When a stock trades at 30x earnings while its peers sit at 15x, the market is pricing in a specific belief: this company will grow faster, generate more durable cash flow, or carry less risk than the group around it.
Three inputs drive that premium or discount. Growth is the most visible: faster expected earnings growth generally justifies a higher multiple, since investors are paying for future dollars, not just this year's. Risk cuts the other way: a business exposed to a single customer, a single regulator, or heavy debt gets penalized with a lower multiple even if today's earnings look identical to a safer peer's. Payout and reinvestment matter too. A company returning cash through dividends or buybacks signals confidence, while one reinvesting heavily might be sacrificing near-term multiples for long-term compounding.
The mistake is treating these drivers as linear. Damodaran's research on relative valuation stresses that fundamentals shift multiples in ways that don't scale proportionally, doubling growth doesn't double the P/E, because the market discounts future growth at a rate that reflects its own uncertainty about whether that growth will show up. A multiple, in other words, is the market's shorthand for a much longer argument about the future. Your job is reconstructing enough of that argument to know whether you agree with it.

Multiples vs. Discounted Cash Flow: Two Different Questions
Multiples and discounted cash flow (DCF) models attack the same problem from opposite directions, and knowing which one you're actually running matters.
A multiple answers a relative question: how is this company priced compared to similar companies right now? It's fast, requires no assumptions about future cash flows, and reflects real market sentiment, including sentiment that might be wrong. A DCF answers an absolute question: what is this business worth based on the cash it will generate over its life, discounted back to today? It requires forecasting revenue, margins, capital spending, and a discount rate, which makes it slower and far more sensitive to the assumptions you feed it.
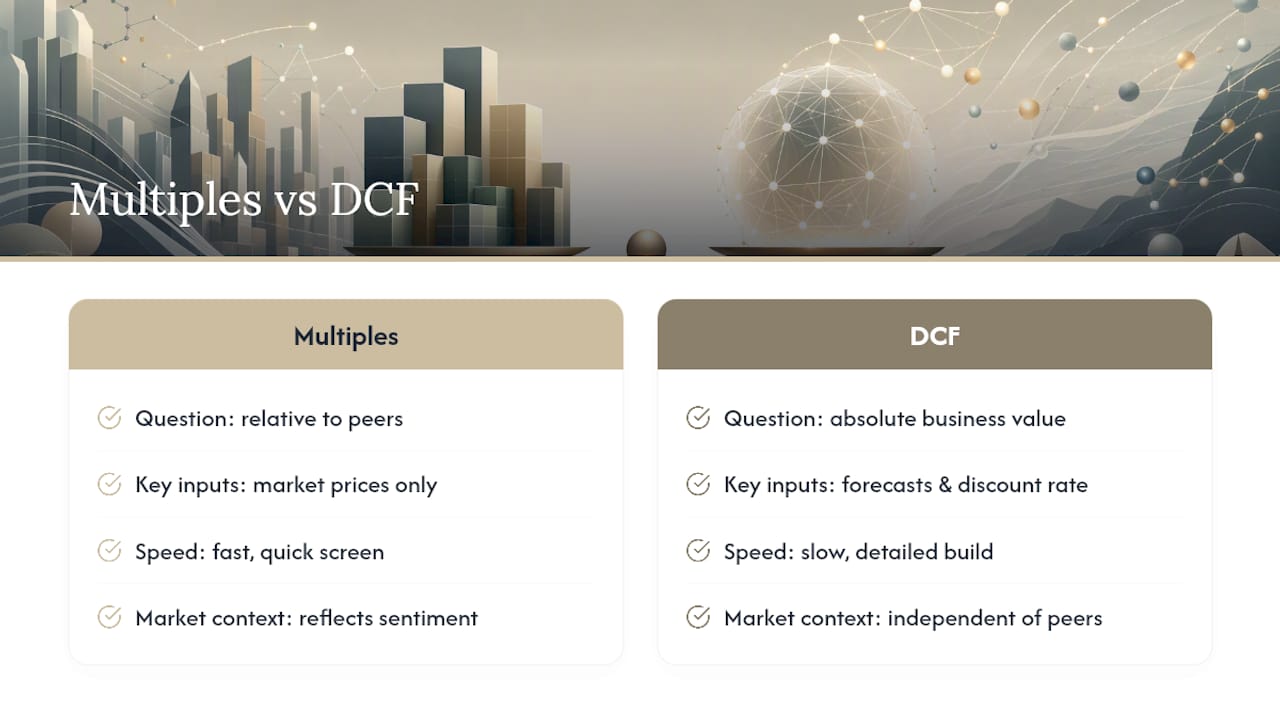
Neither method stands alone reliably. Multiples can misprice an entire sector if the whole peer group is overvalued, since you're just comparing yourself to other expensive things. DCF models can produce a precise-looking number built on imprecise guesses about growth ten years out. The practical answer: use multiples to screen quickly and flag anomalies, then build a DCF when the decision involves real money and you need to understand the specific assumptions driving the price, not just where it sits relative to peers.
Adjusting Multiples for Cyclical Industries
Cyclical sectors, homebuilders, steel producers, airlines, commodity miners, break standard multiple logic in a specific way: earnings at the peak of the cycle look artificially cheap, and earnings at the trough look artificially expensive.
A homebuilder trading at 6x earnings during a housing boom isn't actually cheap; those earnings are inflated and due to fall. The same company at 25x earnings during a downturn isn't expensive; the denominator has collapsed temporarily. This is why analysts covering cyclical names often average earnings or EBITDA across a full cycle, sometimes five to ten years, rather than relying on a single trailing or forward year. Some use "normalized" earnings that estimate what the company would earn at mid-cycle conditions.
Enterprise-value multiples help here too, since EV/EBITDA smooths out some of the leverage effects that compound cyclicality in equity-only metrics. But the core adjustment is mental as much as mathematical: before applying any multiple to a cyclical business, ask where in the cycle current earnings actually sit. A "cheap" multiple on peak earnings is often the most expensive stock in the sector.
Sector-Specific Metrics Beyond the Core Multiples
Core multiples cover most of the market, but several industries lean on specialized metrics that better reflect how those businesses actually create value.
Software and subscription companies often get judged on ARR (annual recurring revenue) multiples, net revenue retention, and customer acquisition cost payback, since traditional P/E tells you little about a company still investing heavily in growth. Consumer internet and social platforms rely on DAU/MAU (daily and monthly active users) and ARPU (average revenue per user) to gauge engagement and monetization before revenue multiples become meaningful. Real estate investment trusts use FFO (funds from operations) instead of net income, since depreciation distorts earnings for property-heavy balance sheets. Insurance companies get evaluated on combined ratio and book value growth rather than EBITDA, which doesn't map cleanly onto how insurers make money. Energy and mining firms often use EV per unit of reserves or production.
The common thread: whenever depreciation, subscription economics, or regulatory accounting makes standard earnings a poor proxy for cash generation, the sector develops its own shorthand. Applying a generic P/E to a REIT or an EV/EBITDA to an early-stage SaaS company without adjustment is a reliable way to reach the wrong conclusion.
Valuation Metrics in M&A, Equity Research, and Investment Decisions
The same multiples get used differently depending on who's asking the question. In mergers and acquisitions, bankers build "precedent transaction" comps, multiples paid in actual prior deals, because those numbers include control premiums and synergy assumptions that public-market trading multiples don't reflect. An acquirer paying 12x EBITDA in an M&A deal is often paying more than the public market multiple because they're buying control and expected cost savings, not just a minority stake.
Equity research analysts use trading multiples to set price targets and flag mispricing relative to peers, typically leaning on forward multiples since their job is forecasting where a stock is headed, not just where it's been. Individual investors making buy-or-hold decisions tend to use multiples more as a sanity check: does this valuation make sense given the growth and risk profile, or is the market pricing in an outcome that seems unlikely?
Each context changes which multiple deserves the most weight. A banker cares about precedent deal multiples and synergy math. An analyst cares about forward estimates and consensus deviation. An individual investor mostly needs to know whether the current price already assumes a level of perfection the business is unlikely to deliver.
Multiples Get You Close. Cash Flow Quality Gets You Right.
Multiples are screening tools, not verdicts. They're fast enough to run across a watchlist in minutes, which makes them the right first filter. But for any allocation that actually matters, a real DCF forces you to defend your growth and risk assumptions instead of borrowing the market's.
What separates a good screen from a false signal usually comes down to earnings quality, how much of that profit is recurring, and how management has handled capital allocation historically. Multiples flag the question. Cash flow and quality answer it.
— Matt
Sources
For further reading: CFA Institute, Aswath Damodaran, Wall Street Prep, and Investopedia. For metric-specific breakdowns, see Oracle Investments' guides on EV/EBITDA, P/E ratio, and the PEG ratio. To see these scores applied in practice, try Oracle Investments.
This article is general information, not a substitute for advice from a qualified financial advisor. Consult a qualified financial professional about your own circumstances before acting on anything here.
- Market-Based Valuation: Price and Enterprise Value Multiples | CFA Institute
- Chapter 18 — Aswath Damodaran (Valuation Multiples)
- Valuation multiples — Wall Street Prep
FAQ
How much is a business worth with $1,000,000 in sales?
It depends on the applicable revenue multiple for its sector.
What does a 10x EBITDA multiple mean?
It means the enterprise value equals ten times the company's EBITDA.
What are the top valuation methods?
The three most widely used approaches are comparable company multiples (like P/E and EV/EBITDA), discounted cash flow analysis, and precedent transaction analysis used heavily in M&A.
Can you explain valuation in a simple way?
Valuation compares what the market is charging for a business against what that business actually earns, generates in cash, or holds in assets. A valuation multiple is simply that comparison expressed as a single ratio.
Should I use trailing or forward multiples?
Use trailing multiples for reliability, since they're based on actual reported results, and forward multiples when you want a view closer to where the company is headed, keeping in mind forward numbers depend on analyst estimates.