
A correct portfolio risk assessment delivers a quantified risk profile, an enforceable risk budget, and a monitoring plan that catches problems before they become losses. Anything less is a slide deck, not an assessment.
That profile needs specific numbers, not vague impressions of "well diversified" or "conservative." If your assessment does not produce every item below, it is incomplete:
- Portfolio volatility (standard deviation of returns)
- VaR and CVaR at a stated confidence level and horizon
- Maximum drawdown, historical and stress-tested
- Factor exposures (style, sector, region, duration, credit)
- Concentration metrics (position, sector, single-factor)
- Scenario and stress-test losses under named conditions
- Recommended position limits and hedge actions
Once you have those seven outputs, the assessment does its actual job: it tells you where to trim, where to hedge, and how much room you have left before you breach your own risk budget.
Key Takeaways
A rigorous portfolio risk assessment combines quantified volatility, tail-risk, and concentration metrics with an enforceable risk budget and a fixed monitoring cadence.
| Point | Details |
|---|---|
| Compute the full metric set | Standard deviation, beta, VaR, CVaR, tracking error, and drawdown together, not any single number alone. |
| Decompose before you diversify | Run factor decomposition to catch latent concentration that simple diversification counts can miss. |
| Treat VaR as a threshold, not a guarantee | A 95% VaR describes the boundary of normal outcomes, not the worst case in the remaining 5%. |
| Turn metrics into enforceable limits | Set risk bands with clear governance, sign-off, and rebalancing triggers, not just target ranges. |
| Use Oracle Investments for the inputs | The app's fundamental scoring and real-time tracking speed up data gathering and produce an auditable comparison base for your risk report. |
Table of Contents
- What Portfolio Risk Assessment Actually Covers
- Types of Portfolio-Level Risk You Need to Identify
- The Core Risk Metrics: Formulas, Interpretation, Limits
- Risk Decomposition: Finding the Correlations Hiding in Plain Sight
- How to Run a Portfolio Risk Assessment Step by Step
- Setting Risk Tolerance and Turning Metrics Into Limits
- Risk Management Strategies That Actually Move the Numbers
- Choosing Tools and Data for the Assessment
- A Worked Example: Portfolio Volatility and VaR in Practice
- Where Judgment Still Beats the Model
- Reporting Risk Results So Stakeholders Actually Act on Them
- How I Approach Portfolio Risk Assessment in Practice
- Put This Workflow Into Practice With Oracle Investments
- Sources
What Portfolio Risk Assessment Actually Covers
Portfolio risk assessment is the measurable appraisal of downside exposure, volatility, concentration, and liquidity risk across a set of holdings, expressed in numbers you can act on. It is not a gut check on how nervous a portfolio makes you feel. It is a structured process that turns raw positions and prices into decision-ready metrics.
The scope splits into four buckets:
- Quantitative metrics — volatility, VaR, CVaR, beta, drawdown, tracking error.
- Qualitative risk drivers — management quality, regulatory exposure, competitive moat erosion.
- Scenario and stress testing — how the portfolio behaves under named historical or hypothetical shocks.
- Reporting and governance — who reviews the output, how often, and what triggers action.
Pro Tip: When position-level data is messy or a holding is thinly traded, don't skip the metric. Use a liquid proxy asset (an ETF or index with similar sector and duration characteristics) and run returns-based style analysis to estimate exposure instead of leaving a gap in the model.
Two resources are worth knowing even if you never touch them directly. FINRA's BrokerCheck lets you verify the background of any registered advisor handling client portfolios, and SIPC coverage matters when custody or counterparty risk enters your assessment. Neither replaces a risk model, but both belong in the due-diligence layer around one.
Types of Portfolio-Level Risk You Need to Identify
Every metric you compute should map back to a specific risk category. If it doesn't, you're measuring something decorative.
- Systematic risk — market-wide moves no amount of diversification eliminates; shows up as beta near or above 1.0.
- Idiosyncratic risk — security-specific shocks (an earnings miss, a fraud disclosure) that diversification genuinely reduces.
- Concentration risk — too much weight in one position, sector, or factor; often invisible until a single theme drives a large portion of portfolio variance.
- Liquidity risk — the inability to exit a position without moving the price; common in small-cap names and private holdings.
- Credit risk — issuer default risk, most relevant in fixed income and corporate bond sleeves.
- Interest-rate and inflation risk — duration exposure and real-return erosion, felt hardest in long-duration bonds and rate-sensitive equities.
- Currency risk — unhedged foreign holdings swinging with FX rates, not just local market performance.
- Operational and event risk — settlement failures, custodial errors, sudden regulatory changes.
- Tail risk — low-probability, high-severity losses that standard deviation systematically understates.
A portfolio that looks calm on paper (low beta, modest volatility) can still carry heavy concentration risk if half its holdings share one supply chain or one regulatory regime. That's the category most assessments miss, and it's the one covered in the decomposition section below.
The Core Risk Metrics: Formulas, Interpretation, Limits
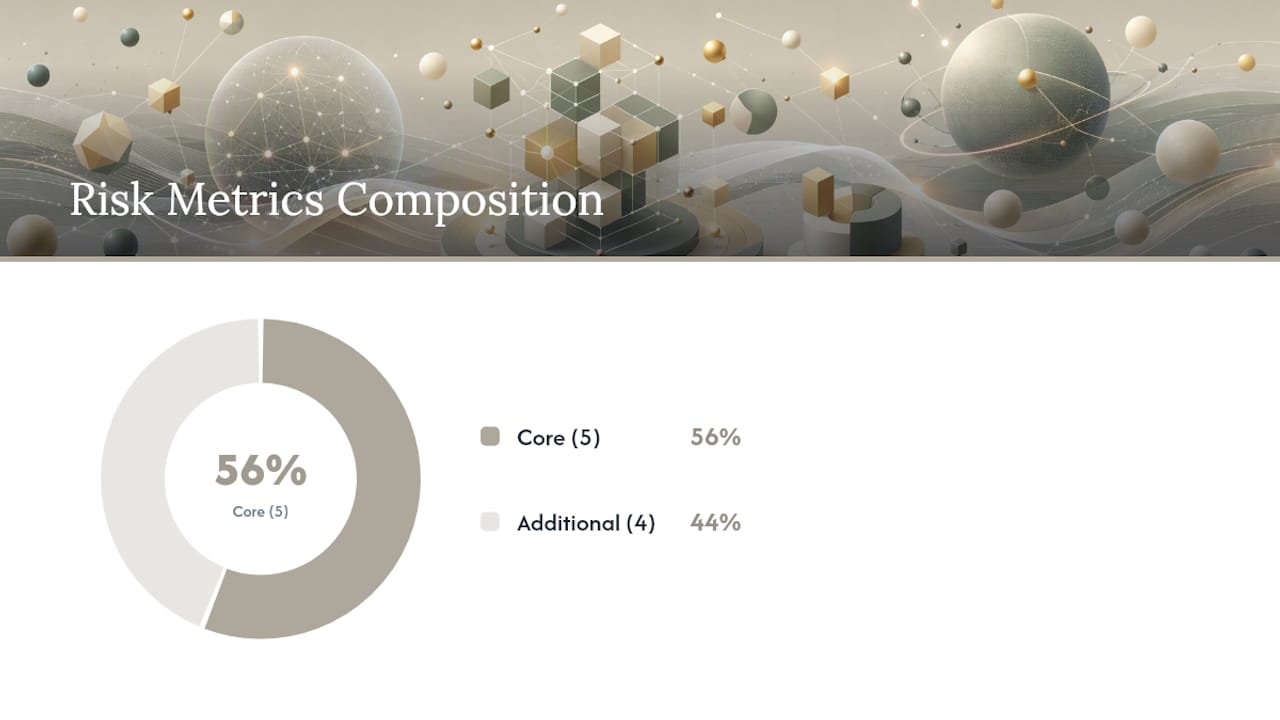
Five metrics form the backbone of any credible risk assessment: alpha, beta, R-squared, standard deviation, and the Sharpe ratio. Add tracking error, maximum drawdown, VaR, and CVaR, and you have a complete quantitative picture.
- Standard deviation measures the dispersion of portfolio returns around their mean. Higher numbers mean wider swings; a 15% annualized standard deviation indicates significant volatility around the average return. It says nothing about direction or tail shape.
- Beta measures sensitivity to a market benchmark. A beta of 1.3 means the portfolio historically moves significantly more than the benchmark in either direction. It's a linear approximation and breaks down during regime shifts.
- R-squared shows how much of a portfolio's movement the benchmark explains, from 0 to 100. A low R-squared makes beta unreliable, since the benchmark isn't a good fit for the portfolio's actual behavior.
- Tracking error is the standard deviation of the difference between portfolio and benchmark returns. It tells active managers how far they're straying from their mandate.
- Maximum drawdown is the largest peak-to-trough decline over a period. It's the number clients actually remember, more than any volatility figure.
- VaR (Value at Risk) estimates the maximum expected loss at a given confidence level over a set horizon, e.g., "95% VaR of $50,000 over one month." It says nothing about how bad the remaining 5% of outcomes could get.
- CVaR (Conditional VaR / expected shortfall) answers that follow-up question by averaging the losses beyond the VaR cutoff. It's a better tail-risk gauge, especially for portfolios with option positions or credit exposure.
- Sharpe ratio measures excess return per unit of volatility. It assumes returns are roughly symmetric, so it can overstate risk-adjusted performance for strategies with negative skew (short volatility, some options-selling programs).
- Alpha is the return left over after adjusting for beta-driven market exposure, the piece attributable to skill or model edge rather than market direction.
Automated scoring systems compress these into a single number for quick comparison. Morningstar's Portfolio Risk Score methodology maps estimated volatility onto a numeric scale and separates market risk from illiquidity risk, using a model-based approach when data coverage allows and returns-based style analysis when it doesn't. That same logic underlies most 1-to-100 style risk scores you'll encounter in retail platforms.
Here's the number that trips people up most: a VaR figure at a high confidence level. CFA Institute's market risk research makes the point directly. A 95% VaR does not mean your portfolio is safe 95% of the time.
For a full numeric walk-through of standard deviation and VaR together, see the worked example further down.
Risk Decomposition: Finding the Correlations Hiding in Plain Sight
Factor decomposition reveals which systematic drivers — style, sector, region, duration, credit — actually explain your portfolio's volatility, rather than treating each holding as an isolated bet. This matters because two portfolios can share the same standard deviation while one is driven by twelve independent factors and the other by a single overexposed theme.
The mechanics start with a covariance matrix. Portfolio variance equals the weighted sum of each asset's variance plus twice the weighted covariance between every pair of assets, so a handful of highly correlated names can dominate total risk even at modest individual weights. Practically, you run this two ways: a commercial risk model that maps holdings to known factors, or returns-based style analysis when you lack security-level data and need to infer exposures from the return series itself.
To run a decomposition:
- Pull historical returns for every holding and the relevant risk factors.
- Estimate the covariance matrix (or use a vendor risk model's precomputed one).
- Regress portfolio returns against factor returns to estimate exposures.
- Rank factor contributions by share of total variance explained.
- Flag any single factor contributing more than roughly 25 to 30% of total risk.
Pro Tip: Latent concentration is the blind spot that catches even experienced managers. A portfolio can look diversified by name count while several holdings share one macro driver, like commodity prices or a specific regulatory regime, that only shows up during market stress, when unrelated-seeming assets suddenly move together. When coverage is thin, favor returns-based methods; when you have clean position-level data across a large model universe, a full risk-model approach catches more nuance.
How to Run a Portfolio Risk Assessment Step by Step
Here's the reproducible sequence, in order:
- Prepare holdings and weights. Pull current positions, market values, and percentage weights as of the assessment date.
- Clean prices and returns. Source consistent price history, adjust for splits and dividends, and align date ranges across all holdings.
- Compute base metrics. Calculate standard deviation, beta, tracking error, and historical maximum drawdown.
- Run factor decomposition. Break total variance into systematic factor contributions and residual idiosyncratic risk.
- Run VaR/CVaR and stress tests. Use parametric, historical, or Monte Carlo methods, then apply named historical shocks (2008, 2020, a rate-shock scenario).
- Assemble the risk budget and limits. Translate metrics into position, sector, and factor caps.
- Recommend actions and set governance. Document hedges, rebalancing triggers, and sign-off responsibilities.
Data requirements scale with sophistication. At minimum you need 12 to 36 months of daily or weekly returns per holding; below that window, volatility estimates get noisy. When a position lacks history, such as a recent IPO or a private allocation, substitute an ETF proxy with comparable sector and duration characteristics rather than excluding it from the model entirely.
Monitoring cadence depends on the book. Hedge funds and derivatives desks typically check VaR and Greeks daily. Most advisory and long-only portfolios are fine reviewing full risk metrics weekly to monthly, with an ad hoc rerun after any large market move. A related discipline worth tracking alongside risk metrics is portfolio drift, since allocation creep between reviews quietly changes your risk profile even when no explicit trade was made.
A complete deliverable includes an executive summary, a metric table, named stress scenarios with dollar and percentage losses, and a short list of recommended limit changes. Skip any one of those four and stakeholders will ask for it anyway.
Setting Risk Tolerance and Turning Metrics Into Limits
Risk tolerance is the process of translating portfolio metrics into explicit limits and a risk budget aligned with an investor's or institution's actual objectives, not their stated comfort level in a conversation. A number on a page is only useful once it becomes a rule someone has to follow.
A workable structure uses three bands, roughly:
- Conservative — lower volatility and VaR targets, tighter concentration caps, minimal use of leverage or derivatives.
- Moderate — wider volatility tolerance, standard diversification limits, selective use of hedges.
- Aggressive — higher volatility and drawdown tolerance, larger single-position and factor caps, active use of leverage or options strategies.
Each band maps to a volatility range and a VaR ceiling appropriate to the account's horizon and liquidity needs rather than a fixed number that applies everywhere.
Governance is what keeps the bands meaningful:
- Define who signs off on the risk budget (portfolio manager, CIO, investment committee).
- Assign a specific owner for ongoing monitoring, not "the team."
- Set rebalancing triggers tied to specific breaches (a position exceeding its cap by more than a stated percentage, for instance).
- Document an exceptions process for temporary breaches, including a deadline to cure them.
Risk Management Strategies That Actually Move the Numbers
Strategy choice depends on which risk category is driving your metrics, so match the tool to the diagnosis rather than reaching for diversification by default.
At the portfolio level:
- Diversification across asset classes and factors, not just security count, reduces idiosyncratic and concentration risk.
- Dynamic rebalancing brings drifted weights back to target before concentration risk compounds.
- Risk parity and risk budgeting allocate exposure by contribution to total risk rather than by dollar weight, which often means smaller allocations to volatile assets.
- Uncorrelated asset allocation (certain alternatives, short-duration credit) dampens portfolio-level volatility without gutting expected return.
- Liquidity cushions ensure the portfolio can meet redemptions or margin calls without forced selling into a falling market.
At the trade level:
- Position sizing caps single-name and single-factor exposure before it becomes a concentration problem.
- Stop limits enforce discipline on individual positions that drift outside their thesis.
- Options hedges (protective puts, collars) cap downside on concentrated equity positions at a known cost.
- Duration management in fixed income controls interest-rate sensitivity directly.
- Credit and FX hedges isolate the specific risk you want to remove without unwinding the underlying position.
Pro Tip: Every hedge has a cost, usually paid in forgone upside or option premium. Match the hedge horizon to the risk you're actually covering, and quantify the annualized drag against the tail protection it buys. A collar that costs 2% a year to avoid a once-a-decade 20% drawdown is a very different trade than one covering a routine 8% pullback.
Choosing Tools and Data for the Assessment
A useful risk engine needs broad instrument coverage (equities, fixed income, derivatives), a scenario module for stress testing, audit logs for every calculation, and export capability so results reach compliance and clients in usable form.
On the data side, you need exchange prices, vendor factor series for decomposition, issuer filings for credit and qualitative review, and an options volatility surface if you're pricing hedges. Illiquid holdings need proxy data pulled from comparable liquid instruments.
Open-source pipelines can cover much of this ground directly. Libraries like portfoliorisk bundle Monte Carlo simulation, GARCH volatility forecasting, VaR/CVaR calculation, and stress testing into a single workflow, useful for teams building in-house tools rather than buying a full platform. Whatever you choose, weigh computation speed against model richness, and backtest your VaR estimates periodically against realized losses to confirm the model still fits.
A Worked Example: Portfolio Volatility and VaR in Practice
- Weights: 60% equities (σ = 18% annualized), 40% bonds (σ = 6% annualized).
- Correlation: assume 0.2 between the two sleeves.
- Portfolio variance: (0.6² × 0.18²) + (0.4² × 0.06²) + (2 × 0.6 × 0.4 × 0.2 × 0.18 × 0.06) ≈ 0.0122, giving a portfolio standard deviation of about 11.05% annualized.
- 95% parametric VaR: convert to monthly sigma (11.05% ÷ √12 ≈ 3.19%), multiply by the 1.645 z-score for a one-tailed 95% confidence level, and apply it to portfolio value: 1.645 × 3.19% × $500,000 ≈ $26,300.
That figure means a roughly 1-in-20 month could see losses exceeding $26,300, not that losses are capped there.
Oracle Investments can supply the weights, historical price data, and scoring inputs that feed this exact calculation, then generate the comparison output in seconds rather than requiring a manual spreadsheet build. Because the app scores holdings on standardized fundamentals, the same session that flags an undervalued stock can also feed the portfolio-level inputs a risk report needs.
Keep the raw price series, the covariance assumptions, and every model choice attached to the final report. That paper trail is what lets you defend the number in a client review and rerun the backtest six months later when the market inevitably proves you at least partly wrong.
Where Judgment Still Beats the Model
No covariance matrix knows about a pending regulatory ruling, a management transition, or a shift in the macro cycle that hasn't shown up in trailing returns yet. Quantitative metrics describe what happened; qualitative overlays account for what's about to.
Practically, that means pairing every risk report with a short qualitative memo covering three things: sector-specific regulatory or competitive threats, macro conditions that could invalidate the historical correlation assumptions baked into your covariance matrix, and management or governance red flags at issuer level for concentrated positions. A portfolio heavy in regional banks looked fine on a standard deviation basis right up until deposit flight risk became a factor nobody's model had priced in.
Market outlook matters most for calibrating scenario assumptions. If you're building stress tests off 2008 or 2020 shocks, ask whether current conditions (rate environment, credit spreads, valuation levels) make a repeat more or less likely than the historical base rate suggests. This is where issuer-level financial health analysis earns its place inside a quantitative framework instead of sitting in a separate research silo.
The failure mode to avoid is letting qualitative judgment override every uncomfortable number, which just reintroduces the bias the quantitative process was built to remove. The better use is narrower: qualitative input adjusts which scenarios you test and how much weight you give tail outcomes, not whether you trust the math at all.
Reporting Risk Results So Stakeholders Actually Act on Them
A risk report that nobody reads changes nothing, so format the output for the audience receiving it, not for the analyst who built the model.
For investment committees and boards, lead with the executive summary: current risk band, any limit breaches, and the one or two actions being recommended. Save the full metric table and factor decomposition for an appendix they can request if they want detail.
For portfolio managers and analysts, the full metric table matters, including confidence intervals and the underlying assumptions behind each VaR or CVaR figure. This is the audience that needs to see the covariance inputs and stress scenario definitions, since they're the ones deciding whether to act on the recommendation.
For clients, translate metrics into plain outcomes: "a market decline similar to 2020 would be expected to reduce this portfolio's value by approximately X%," rather than leading with a Greek letter or a Sharpe ratio. Most clients remember drawdown numbers, not standard deviations.
Cadence matters as much as content. A monthly one-page summary paired with a full quarterly deep dive keeps stakeholders informed without burying them in updates they'll skim past. Whatever cadence you pick, keep the format consistent between periods so readers can spot trend changes in the numbers themselves rather than hunting for what moved between differently structured reports.
How I Approach Portfolio Risk Assessment in Practice
Treat risk as a budget you allocate on purpose, not a byproduct you discover after the fact. That single habit changes the order you fix things in.

Concentration gets addressed first, always, because it's the risk most likely to blindside a portfolio that looks fine on every other metric. When I explain results to stakeholders who don't think in standard deviations, I lead with dollar drawdown scenarios and skip the Greek letters entirely; nobody outside a trading desk has ever made a better decision because they saw a Sharpe ratio first. Run the full metric suite monthly at minimum, and immediately after any market move large enough to make you second-guess your assumptions.
The recurring mistakes are consistent across the accounts I've reviewed: leaning too hard on historical covariance that stops working exactly when volatility regimes shift, ignoring liquidity until a redemption request forces a fire sale, and treating a comfortable VaR number as a safety guarantee rather than a threshold that gets breached on a predictable, if infrequent, basis.
Put This Workflow Into Practice With Oracle Investments
Running the workflow above by hand across a real portfolio, dozens of holdings, multiple factor exposures, a covariance matrix that needs updating every time a position changes, eats hours that most investment professionals and serious individual investors don't have to spare every week.

Oracle Investments scores over 260 stocks on profitability, valuation, and financial health, then lets you compare holdings side by side and track a full portfolio in real time. That combination turns the manual steps in this guide, pulling fundamentals, checking concentration, flagging weak holdings, into an instant comparison you can rerun as often as your monitoring cadence requires. The scoring layer also documents the inputs behind every comparison, which supports the audit trail a proper risk report needs.
If you manage a portfolio of individual stocks and want the fundamental inputs behind your risk assessment without building a spreadsheet from scratch, try Oracle Investments and run your current holdings through it this week.
Sources
- What Are the 5 Principal Risk Measures and How Do They Work?
- Developer
- Measuring and managing market risk (CFA Institute refresher, 2026)
This article is general information, not a substitute for advice from a qualified financial advisor. Consult a qualified financial professional about your own circumstances before acting on anything here.