
The Piotroski F-score is a 0 to 9 composite of nine binary accounting signals designed to filter higher-quality value stocks. Each signal earns either 1 point (pass) or 0 (fail), and the sum tells you how financially sound a company looks compared with the prior year. A high score doesn't guarantee a winning stock, but it flags companies with improving fundamentals worth a closer look, especially inside a cheap, beaten-down universe.
Stanford accounting professor Joseph Piotroski built the score in 2000 and back-tested it against a large sample of high book-to-market firms. The results held up:
- High scores indicate strong financial improvement
- Moderate scores sit in a gray zone requiring more digging
- Low scores flag deteriorating fundamentals worth avoiding
Key Takeaways
A company's Piotroski F-score works best as a quality filter applied to already-cheap stocks, not as a standalone buy signal on its own.
| Point | Details |
|---|---|
| Score range and meaning | The F-score runs 0 to 9, built from nine binary tests across profitability, leverage, and efficiency. |
| Interpret by band | Treat 8 to 9 as strong, 3 to 7 as mixed and worth deeper digging, 0 to 2 as a warning sign. |
| Pair with valuation | Combine the F-score with a low price-to-book or low P/E screen, since Piotroski designed it for value stocks. |
| Watch for accounting noise | Check footnotes for one-time items before trusting a test result, especially the accruals test. |
| Compare fundamentals faster | Oracle Investments scores 260+ stocks on comparable fundamentals so you can rank candidates without building spreadsheets from scratch. |
Table of Contents
- What Does the Piotroski F Score Actually Measure?
- How Do You Calculate the Piotroski F Score Step by Step?
- What Do Different F-Score Ranges Mean for Investors?
- How Do You Compute an F-Score in a Spreadsheet?
- Where Does the F-Score Fall Short?
- How Do You Put the F-Score to Work in a Portfolio?
- What the F-Score Debate Gets Wrong
- Screen Smarter With Oracle Investments' Fundamentals Scoring
- Primary Sources and Further Reading
- Sources
What Does the Piotroski F Score Actually Measure?
The nine tests fall into three groups, and each group answers a different question about a company's health.
- Profitability (four points). Return on assets, operating cash flow, the change in ROA year over year, and an accruals check comparing cash flow to net income. This group asks whether the company is actually generating cash from operations, not just reporting an accounting profit.
- Leverage, liquidity, and source of funds (three points). Change in long-term debt, change in the current ratio, and whether new shares were issued. This group asks whether the balance sheet is getting safer or riskier, and whether growth is funded internally or through dilution.
- Operating efficiency (two points). Change in gross margin and change in asset turnover. This group asks whether the core business is getting better at converting sales into profit and assets into revenue.
Pro Tip: Don't treat the three groups as equally predictive on their own. Piotroski's back-test found the profitability signals carried the most weight in separating future winners from losers, so a company failing multiple profitability tests deserves extra scrutiny even if its leverage score looks fine.
How Do You Calculate the Piotroski F Score Step by Step?
Each of the nine tests compares the current fiscal year against the prior year, so you need two full years of financial statements: the income statement, cash flow statement, and balance sheet. Here's each binary test, worded so you can drop it straight into a spreadsheet.
- ROA positive: net income / beginning total assets > 0 → 1 point
- CFO positive: cash flow from operations > 0 → 1 point
- ΔROA: current-year ROA higher than prior-year ROA → 1 point
- Accruals: CFO / beginning total assets greater than ROA (net income / beginning total assets) → 1 point
- ΔLeverage: long-term debt as a share of average total assets decreased year over year → 1 point
- ΔLiquidity: current ratio (current assets / current liabilities) increased year over year → 1 point
- No new shares issued: shares outstanding this year not higher than last year → 1 point
- ΔGross margin: gross margin increased year over year → 1 point
- ΔAsset turnover: revenue / beginning total assets increased year over year → 1 point
The aggregate F_SCORE is simply the sum of these nine binary signals, which is exactly why Piotroski built it this way: no probability model, no regression, just a countable checklist any investor can replicate.
A few pitfalls trip up almost everyone doing this by hand. Non-recurring items (a one-time asset sale, a legal settlement) can distort net income and falsely flip a profitability test. Restated prior-year figures need to be pulled from the restated filing, not the original one, or your year-over-year comparisons break. And GAAP versus non-GAAP earnings matter: always use GAAP net income for the ROA and accruals tests, since adjusted figures are management's own framing, not an objective baseline.
What Do Different F-Score Ranges Mean for Investors?
A score of 8 or 9 marks a company with broadly improving fundamentals across profitability, balance sheet strength, and operating efficiency. A score of 3 to 7 is mixed. Some tests pass, some fail, and you need to read which specific tests failed before drawing conclusions. A score of 0 to 2 signals a company whose financial position is deteriorating on most measures, a red flag regardless of how cheap the stock looks.
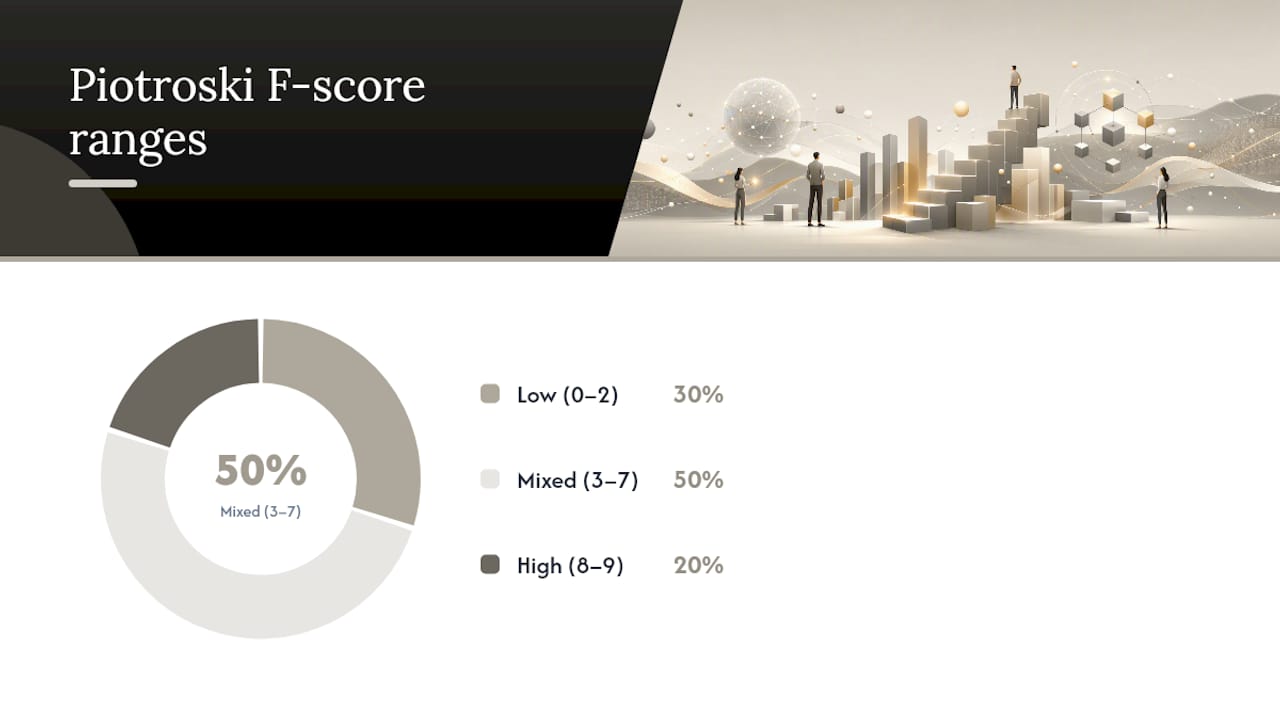
Piotroski's original research is the reason these bands stick. His back-test found firms scoring 8 or 9 delivered markedly higher one-year market-adjusted returns than firms scoring 0 to 2, with the low-score group posting negative average returns over the same period.
The score works best paired with a valuation screen. Investopedia notes that Piotroski designed it as a filter for cheap stocks specifically, low price-to-book names, rather than as a standalone signal across the whole market. Two caveats matter here:
- The effect is strongest in small-cap value stocks, where accounting data reveals more about an impending turnaround than it does for a heavily covered large-cap name.
- Industry effects can distort comparisons. Capital-intensive industries and asset-light software firms don't behave the same way on leverage or asset turnover tests, so comparing F-scores across sectors without adjustment is a common mistake.
How Do You Compute an F-Score in a Spreadsheet?
Building your own tracker takes less time than most investors expect once you know the layout.
- Pull two years of income statement, balance sheet, and cash flow data into adjacent columns.
- Calculate the nine intermediate ratios (ROA, CFO/assets, current ratio, gross margin, asset turnover, and so on) for both years.
- Write an
IFformula for each of the nine tests:=IF(current_ROA>0,1,0)is the pattern for most of them. - Sum the nine
IFresults into a single cell. That's your F-score. - Handle missing data by leaving the test blank rather than defaulting to zero, so an incomplete filing doesn't unfairly tank the score.
| Data Point Needed | Source Statement | Common Pitfall |
|---|---|---|
| Net income | Income statement | Excluding one-time gains/losses |
| Operating cash flow | Cash flow statement | Confusing CFO with free cash flow |
| Total assets (beginning) | Balance sheet | Using ending instead of beginning balance |
| Shares outstanding | Balance sheet / equity notes | Ignoring dilution from stock plans |
You don't have to build this from scratch. Corporate Finance Institute's F-score calculator gives you a ready-made template with the nine tests already formatted, which is a faster starting point than reinventing the formulas yourself.
Where Does the F-Score Fall Short?
Piotroski's back-test is the strongest evidence behind the method, and later practitioner work has generally supported the pattern: financially improving cheap stocks tend to outperform financially deteriorating cheap stocks. That said, the score has real limits.
- It's built for value stocks, not growth companies. A high-growth firm burning cash on purpose can fail several tests while executing exactly the right strategy.
- Accounting noise creates false signals. One-off write-downs, mergers, or currency swings can flip a test without reflecting real operating change.
- Industry differences distort comparisons, particularly around leverage and asset turnover.
- Small-sample and single-year snapshots can mislead. A company can pass 8 tests in one year and stumble the next.
Pro Tip: Run the F-score alongside a manual glance at the notes to financial statements. A single asset sale can flip two or three tests at once, and five minutes reading the footnotes will tell you whether the improvement is real or an accounting artifact.
Mitigate these risks by pairing the F-score with a value screen (low price-to-book, for instance), spot-checking the underlying filings, and diversifying across multiple high-scoring names rather than betting on one.

How Do You Put the F-Score to Work in a Portfolio?
The standard workflow is straightforward: start with a value screen (low price-to-book or low P/E), then rank the surviving names by F-score, and prioritize the 8s and 9s for deeper research. Rebalance the screen quarterly or annually as new financial statements arrive, since the score is only as current as the last filing.
Position sizing matters as much as stock selection. An F-score of 9 doesn't excuse skipping diversification. Treat it as a quality filter that improves your odds within a basket of ideas, not a green light to concentrate a portfolio in a single name.
- Screen for value first, then apply the F-score as a quality overlay
- Rank candidates and focus research time on the top scorers
- Revisit scores after each earnings cycle, since a 9 can become a 6 within a year
Oracle Investments applies similar thinking across its fundamentals scoring system, which lets you compare companies side by side on profitability, valuation, and financial health rather than computing nine ratios by hand for every candidate. Readers who want to go deeper on the profitability leg of the score should look at how return on invested capital complements ROA-based screens.
The nine-test structure exists precisely because most investors don't have time to build a probability model for every stock they're considering. A checklist you can run in an afternoon, applied consistently, beats a sophisticated model you never actually use.
What the F-Score Debate Gets Wrong
Most explainers treat the Piotroski F-score like a standalone buy signal: hit 8 or 9, buy the stock. That's not what Piotroski's own research supports. His back-test specifically applied the score to a high book-to-market universe, meaning it was designed to sort already cheap stocks into improving versus deteriorating buckets. Strip out the valuation filter and you lose most of the documented edge.
The bigger gap I see in how people use this tool is treating a single year's score as a verdict rather than a data point. A company's score of 9 this year tells you almost nothing about whether it'll still be a 9 next year, and Piotroski's methodology was never meant to be a one-time gate you pass once and forget.
If you take one thing from this, prioritize the accruals and cash flow tests over the others. A company can manufacture ROA growth through accounting choices far more easily than it can manufacture real operating cash flow. When those two disagree, believe the cash flow.
Screen Smarter With Oracle Investments' Fundamentals Scoring
Running nine ratio tests by hand across a watchlist of candidates eats an afternoon fast, and most spreadsheet templates break the moment a company restates a prior year. Oracle Investments scores over 260 stocks on the same profitability, valuation, and financial health dimensions the F-score draws from, so you can compare candidates side by side instead of rebuilding formulas every quarter.

The app pairs that scoring with real-time portfolio tracking and instant comparisons, plus the investing frameworks of Warren Buffett, Charlie Munger, and Peter Lynch built into the same interface. If you've just learned to read an F-score by hand, see how Oracle Investments turns fundamentals into a value rating you can check in seconds, then start comparing your own watchlist today.
Primary Sources and Further Reading
- Piotroski's original F-score paper
- Investopedia's F-score breakdown
- CFI's F-score calculator template
- Wikipedia's F-score overview
Sources
- F-Score (Piotroski) — Joseph D. Piotroski (UCLA/Anderson paper excerpt)
- Piotroski Score: 9 Criteria for Analyzing Value Stocks — Investopedia
- Piotroski F Score Calculator - Corporate Finance Institute
- Piotroski F-score — Wikipedia