
GARP investing is a hybrid stock-picking approach that targets companies with above-market earnings growth still trading at sensible valuations. The PEG ratio is the fastest entry point: screen for stocks with a PEG at or below 1, and you have a working GARP filter in minutes. Prefer a hands-off route? The iShares MSCI USA Quality GARP ETF (ticker: GARP) gives you instant, diversified exposure built on institutional methodology. S&P Dow Jones Indices runs the S&P 500 GARP Index, the S&P MidCap 400 GARP Index, and the S&P SmallCap 600 GARP Index, each applying a two-step sequential filter that institutional managers use as a benchmark.
Two ways to start today:
- Fastest DIY method: Run a PEG ≤ 1 screen on a major broker screener, then cross-check ROE and debt-to-equity to filter out low-quality names.
- Easiest hands-off option: Buy or paper-trade the iShares MSCI USA Quality GARP ETF and read its prospectus to understand what the underlying S&P GARP index actually selects.
Key Takeaways
GARP investing works best when you combine a PEG-based quantitative screen with qualitative checks on earnings quality and competitive position, then monitor holdings at least semi-annually for drift.
| Point | Details |
|---|---|
| GARP defined | A hybrid of growth and value investing: target companies with 10%+ EPS growth trading at a PEG ≤ 1. |
| Primary metric: PEG | Use a capped, three-year growth estimate in the denominator; a PEG of 0.5–1.0 provides a margin of safety. |
| ETF vs. stock-picking | ETFs (e.g., iShares MSCI USA Quality GARP ETF) offer diversification and auto-rebalancing; DIY screens give control but require qualitative follow-up. |
| Main risks | Growth estimate error, sector concentration, and earnings surprises can all cause a GARP pick to reprice sharply. |
| Oracleinvestments | Scores 260+ stocks on PEG, ROE, and leverage so you can run a GARP screen in minutes, not hours. |
Table of Contents
- What is GARP investing, and how does it sit between growth and value?
- Core metrics GARP investors use and what each tells you
- How institutions build GARP indices and ETFs
- How to build a practical GARP stock screen
- What the evidence shows about GARP performance and the main risks
- Quick GARP stock checklist and red flags
- Fast ways to try GARP: ETFs, screeners, and a 30-minute test
- Why a disciplined GARP approach fits many individual investors
- Oracleinvestments makes GARP screening faster
- Primary sources worth reading
- Sources
What is GARP investing, and how does it sit between growth and value?
Growth at a reasonable price is exactly what the name says: you want growth, but you refuse to pay any price for it. Investopedia defines GARP as a hybrid of growth and value investing that looks for companies with consistent earnings and sales growth, reasonable valuations, and quality metrics such as ROE and low leverage. Peter Lynch, who ran the Fidelity Magellan Fund from 1977 to 1990 and popularized the PEG ratio, is the strategy's most cited practitioner. S&P Dow Jones Indices (SPDJI) later formalized the idea into a systematic index methodology.
Here is the contrast that makes GARP click. A GARP investor looks at the same company, sees a PEG of 1.5, and passes. That second company is the GARP pick. The growth is real and durable, the price is defensible, and there is room for the multiple to expand rather than compress.
The goal is not to time the market or chase momentum. GARP aims for long-term, consistent compounding by owning quality businesses at prices that do not require a perfect future to justify the investment.
Core metrics GARP investors use and what each tells you
Every GARP screen starts with the same short list of metrics. Here is what each one measures and the ranges practitioners typically use. These are practitioner conventions, not hard rules.
- PEG ratio (P/E ÷ expected EPS growth rate): The central GARP metric. A PEG at or below 1 suggests the stock's price is roughly in line with its growth rate. Many practitioners prefer a tighter range of 0.5–1.0 to build in a margin of safety against forecast error. Desjardins' GARP overview lists PEG ≤ 1 as the primary valuation filter, alongside a P/E roughly in the 15–25 range and expected EPS growth of 10–20% annually.
- 3-year EPS growth: Trailing three-year compound annual growth in earnings per share. Practitioners prefer three years over one to smooth out one-off quarters. A common minimum is 10% CAGR.
- 3-year sales (SPS) growth: Revenue growth confirms that earnings growth is not purely a buyback or margin story. S&P's methodology uses both EPS and SPS growth in its growth z-score calculation.
- Earnings-to-price (E/P): The inverse of P/E. S&P's QV composite uses E/P rather than P/E because it behaves more linearly and is easier to combine with other z-scores in a composite.
- Return on equity (ROE): Measures how efficiently a company generates profit from shareholders' equity. A GARP screen typically requires ROE above 15%, though the exact threshold depends on the sector. For deeper context on profitability ratios, ROE sits alongside ROIC as a key quality signal.
- Financial leverage / debt-to-equity: High debt amplifies both gains and losses. GARP investors treat leverage as a quality filter, not just a risk flag. S&P's QV composite explicitly includes leverage as a quality component.
- Price-to-book (P/B): Used as a sanity check rather than a primary filter. A very high P/B relative to peers can signal that the market has already priced in the growth you are hoping to capture.
Pro Tip: *Use three-year trailing EPS growth or a consensus three-to-five-year analyst estimate rather than a single forward year.
How institutions build GARP indices and ETFs
S&P Dow Jones Indices turned GARP from a practitioner heuristic into a systematic index methodology. Understanding the mechanics helps you evaluate any GARP ETF you are considering.
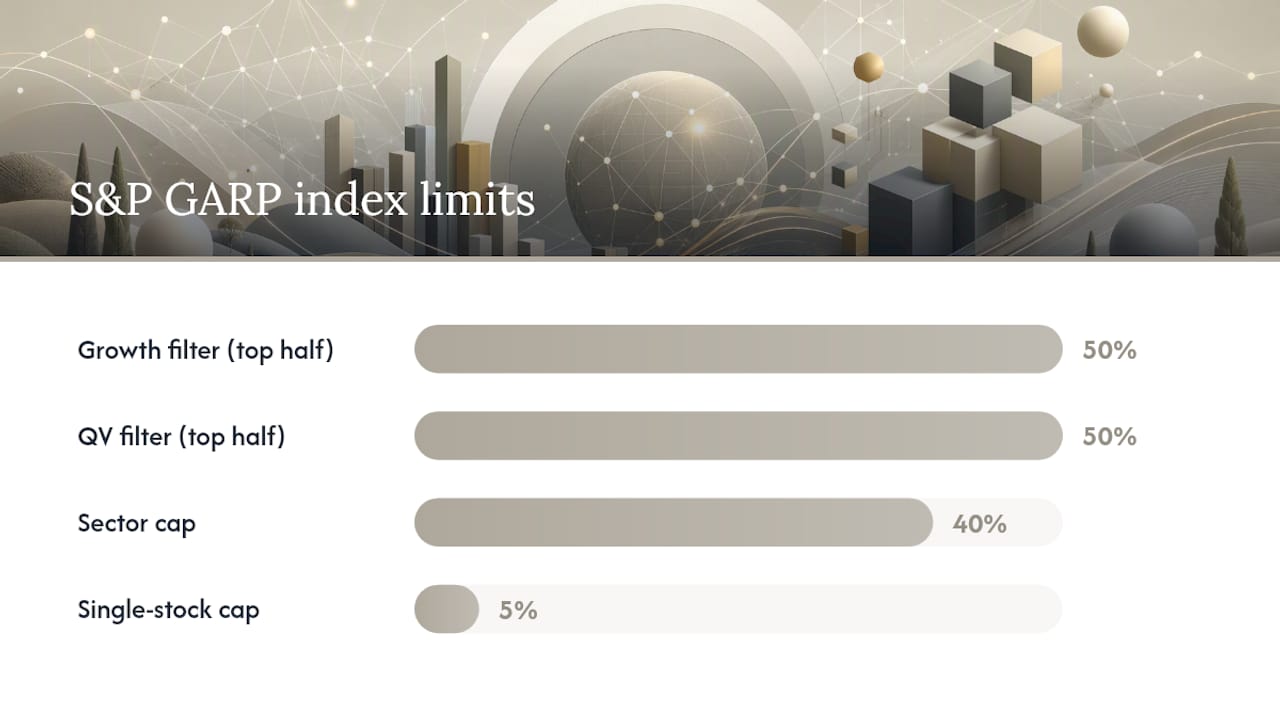
The S&P systematic GARP methodology works in two sequential layers. First, every stock in the parent index (S&P 500, MidCap 400, or SmallCap 600) receives a growth z-score based on the average of its three-year EPS growth and three-year sales-per-share (SPS) growth. The top half by growth z-score advances to the second layer. Those survivors then receive a Quality/Value (QV) composite z-score built from three components: earnings-to-price, ROE, and financial leverage. The top half of survivors by QV score become index constituents. Weighting is proportional to the growth z-score, not market cap, which means faster-growing companies get larger allocations within the rules.
Two concentration controls matter for investors. Buffer rules at each rebalance reduce unnecessary turnover by keeping borderline names in the index unless they fall well outside the selection zone.
| Dimension | S&P GARP Index approach |
|---|---|
| Growth metric | 3-year EPS growth and 3-year SPS growth (averaged into a z-score) |
| Valuation metric | Earnings-to-price (E/P) as part of QV composite |
| Quality metrics | ROE and financial leverage (both in QV composite) |
| Selection method | Sequential filtering: top half by growth, then top half by QV score |
| Weighting | Growth z-score weighted; 5% single-stock cap; 40% sector cap |
| Rebalance | Semi-annual with buffer rules to limit turnover |
The iShares MSCI USA Quality GARP ETF tracks a related but distinct methodology from MSCI rather than SPDJI, combining quality and growth screens with valuation discipline. iShares notes that GARP can materially reduce extreme concentration in a handful of mega-cap growth names while still keeping exposure to the major growth themes investors want.
How to build a practical GARP stock screen
You can run a working GARP screen on any major broker's free screener in under 30 minutes. Here is a sequenced workflow with sample settings.
-
Set your universe. Start with U.S.-listed stocks with a market cap above $2 billion. Smaller caps can qualify, but liquidity and analyst coverage tend to be limited below that threshold, making growth estimates less reliable.
-
Apply the growth filter first. Set a minimum threshold for three-year EPS growth and add a revenue growth filter to confirm the earnings growth is not purely a margin or buyback story. This step considerably reduces the universe of stocks.
-
Apply the valuation filter. Set a PEG cutoff at or below 1 using forward EPS estimates (one-year or consensus three-year). Alternatively, use earnings yield or P/E multiples as cross-checks.
-
Run quality sanity checks. Filter for ROE at a reasonable threshold and moderate debt-to-equity ratios, adjusted for sector norms, to exclude overly leveraged growth stories.
-
Review each candidate manually. For every stock that passes the quantitative screen, spend five minutes on three qualitative checks: Does the company have a durable competitive advantage (pricing power, switching costs, network effects)? Has management maintained or raised guidance in the last two quarters? Are earnings quality high, meaning operating cash flow is tracking close to reported net income, with no large one-time gains inflating the numbers?
-
Size and record your positions. Log the PEG, ROE, and debt-to-equity for each position at entry. You will use these benchmarks at your next review to decide whether a holding has drifted out of GARP territory.
What the evidence shows about GARP performance and the main risks
The S&P practitioner guide reports that S&P GARP Indices have historically outperformed their parent benchmarks on both total return and risk-adjusted measures in back-tested and historical exhibits, with positive information ratios versus the S&P 500. These are back-tested results, not live performance guarantees, and back-tested figures always carry the risk of overfitting to the historical period studied.
Why do hybrid strategies like GARP behave differently from pure growth or pure value? Ken French's decomposition research shows that growth portfolios' capital gains are largely driven by reinvestment of earnings, while value portfolios' gains historically come more from convergence in price-to-book ratios. GARP sits between those two return engines, capturing some of both.
The main risks to watch:
- Growth estimate error: PEG is only as good as the growth estimate in the denominator. Analyst consensus estimates for three-to-five-year EPS growth are notoriously optimistic, which means a stock's PEG can look attractive until the estimate gets revised down.
- Valuation traps: A low PEG can reflect a genuinely cheap stock or a business in structural decline where the market has correctly marked down future growth. Qualitative checks are not optional.
- Sector concentration: GARP screens often surface technology and healthcare names because those sectors combine high ROE with visible growth. Without sector caps like the 40% limit S&P enforces, a DIY GARP portfolio can become dangerously concentrated.
- Earnings surprises: A single bad quarter that resets the growth trajectory can cause a GARP stock to reprice sharply, since the valuation was anchored to a growth rate that no longer holds.
- Turnover costs: Systematic GARP screens rebalance regularly. Each rebalance triggers transaction costs and, in taxable accounts, potential capital gains. The S&P methodology uses buffer rules to reduce this, but DIY investors need to account for it explicitly.
Quick GARP stock checklist and red flags
Use this list when reviewing any candidate that passes your quantitative screen.
Green lights (confirm before buying):
- PEG ≤ 1 using a realistic, capped growth estimate
- Three-year EPS CAGR ≥ 10%, confirmed by three-year revenue growth ≥ 7%
- ROE ≥ 15% for two or more consecutive years
- Debt-to-equity below 1.0 or below the sector median
- Operating cash flow tracking close to reported net income (no large non-cash gains)
- Management guidance stable or raised in the last two quarters
- Identifiable competitive advantage (pricing power, switching costs, or network effects)
Red flags (investigate or pass):
- PEG looks low because of a one-time earnings spike (a tax benefit, asset sale, or restructuring charge that inflated EPS in the base year)
- ROE declining over three years even as reported earnings grow
- Debt-to-equity rising sharply, especially if the company is funding growth through borrowing rather than operations
- Revenue concentrated in one customer, one geography, or one product line
- Frequent restatements, aggressive revenue recognition, or large gaps between GAAP and adjusted earnings
- Guidance cuts or management turnover in the past 12 months
Avoiding common value investing mistakes overlaps heavily with this checklist. Many of the same traps that catch value investors — buying cheap without understanding why — also catch GARP investors who skip the qualitative step.
Fast ways to try GARP: ETFs, screeners, and a 30-minute test
The ETF route is the lowest-friction starting point. The iShares MSCI USA Quality GARP ETF gives you instant, diversified exposure to a rules-based GARP methodology with daily liquidity and full transparency into holdings. The tradeoff, as iShares acknowledges, is that ETF implementations trade control for convenience: you get instant exposure and automatic rebalancing, but you cannot exclude individual names or apply qualitative views. Check the fund's expense ratio and tracking methodology in the prospectus before buying. Compare the sector weights to the S&P 500 to understand where the active bets are.
The DIY screener route takes more work but gives you full control. Major broker platforms (Fidelity, Charles Schwab, and TD Ameritrade all offer free screeners) let you filter by PEG, EPS growth, ROE, and debt-to-equity. Public financial data sites like Finviz and Macrotrends provide the same filters without a brokerage account. Run the six-step screen from the section above, then paper-trade the output for one quarter before committing real capital. Watching how your GARP candidates behave around earnings announcements teaches you more about the strategy's real-world behavior than any back-test.
A 30-minute paper-trade test: Pick five stocks that pass your screen, record their PEG, ROE, and debt-to-equity in a spreadsheet, and track them for 90 days. Note which ones hold their growth estimates and which get revised. That exercise alone will sharpen your intuition for which qualitative signals actually matter.

For deeper valuation cross-checks beyond PEG, the EV/EBITDA multiple is worth adding to your toolkit, particularly for capital-intensive businesses where P/E can be distorted by depreciation schedules.
Why a disciplined GARP approach fits many individual investors
Most individual investors sit in one of two uncomfortable positions: they own a growth-heavy portfolio that feels expensive every time rates rise, or they own a value-heavy portfolio that keeps looking cheap for longer than they expected. GARP is not a magic fix, but it does address a real behavioral problem. When you anchor a purchase to a PEG ≤ 1, you have a concrete reason to pass on a stock that feels exciting but is priced for perfection.
For long-term investors who want growth exposure without paying sky-high multiples, GARP works well as a core sleeve rather than a total portfolio replacement. Pair it with a broad index fund for market coverage, and use GARP picks to tilt toward quality growth without abandoning valuation discipline. If you already hold concentrated positions in high-multiple growth names, a GARP screen is a useful way to identify where you might rotate some of that exposure into names with better risk/reward profiles.
The monitoring requirement is real. GARP positions need a review at least semi-annually: check whether the growth rate is holding, whether the PEG has expanded beyond your entry threshold, and whether any red flags from the checklist have appeared. A stock that was a GARP pick at a PEG of 0.9 can become a pure growth bet at a PEG of 1.8 after a strong run. Knowing when to trim is as important as knowing what to buy.
Oracleinvestments makes GARP screening faster
Running a GARP screen manually across hundreds of stocks takes time you may not have. Oracleinvestments scores over 260 U.S.-listed stocks on the exact fundamentals a GARP investor cares about: profitability, valuation, and financial health. PEG, ROE, and leverage filters are built in, so you can move from universe to shortlist in minutes rather than hours.

The app also surfaces the investment frameworks of Warren Buffett, Charlie Munger, and Peter Lynch, the investor who popularized the PEG ratio, so you can cross-check your GARP candidates against the qualitative standards those investors applied. Real-time portfolio tracking lets you monitor whether your holdings are drifting out of GARP territory between formal reviews.
No screening tool eliminates the need for judgment. Validate every candidate against the checklist above, confirm fees and tax implications before acting, and verify advisor credentials through FINRA BrokerCheck if you work with a professional. Ready to run your first GARP screen? Start with Oracleinvestments and see which stocks pass all five filters today.
Primary sources worth reading
These are the documents that underpin the methodology and historical figures in this article. Read the index methodology docs before buying any GARP ETF.
- S&P systematic GARP methodology (SPGlobal): Detailed rules for growth z-scores, QV composite construction, weighting, and the 5% stock and 40% sector caps.
- iShares GARP investing commentary: Explains the concentration-reduction rationale and the ETF implementation tradeoffs from the issuer's perspective.
- Investopedia GARP explainer: A clear plain-language overview of the strategy, PEG thresholds, and the quality emphasis.
- Desjardins GARP overview: Practical numeric ranges (PEG ≤ 1, P/E 15–25, EPS growth 10–20%) with a useful caution on qualitative checks.
- Ken French / Dartmouth decomposition paper: Academic grounding for why growth and value portfolios have different return drivers, covering data from 1963–2004.
This article is for general informational purposes only and does not constitute investment advice. Consult a qualified financial professional and review current index methodology documents before making investment decisions.
This article is general information, not a substitute for advice from a qualified financial advisor. Consult a qualified financial professional about your own circumstances before acting on anything here.
Sources
- Growth at a reasonable price: The case for GARP investing (iShares)
- Value and growth research (Ken French / Dartmouth)