
Short interest is the total number of shares investors have sold short and haven't yet bought back to close out. When it's high or climbing, it usually means more traders are betting the stock will fall. It also raises the odds of a short squeeze, where those same traders get forced to buy back shares fast, pushing the price up. The catch: it's one data point, not a verdict.
- Short interest = open short positions, not total trading activity
- Rising short interest generally signals bearish sentiment
- High short interest can fuel a short squeeze if the stock rallies
- Always pair it with other indicators before making a call
Key Takeaways
Short interest measures open short positions and works best as a sentiment signal when paired with fundamentals, not used alone.
| Point | Details |
|---|---|
| Definition matters | Short interest counts shares sold short and not yet covered, reported roughly twice a month. |
| Days-to-cover formula | Divide short interest by average daily volume to estimate how fast shorts could exit. |
| Interpretive ranges | Under 2 days is low, 2 to 5 is moderate, and 10 or more suggests covering difficulty. |
| Watch for data lag | Biweekly reporting means the figure you see can already be outdated. |
| Pair it with fundamentals | Oracle Investments combines sentiment context with stock scoring across 260+ companies for a fuller picture. |
Table of Contents
- What Short Interest Measures and How Short Selling Creates It
- How to Calculate the Short Interest Ratio (Days to Cover)
- Where Do You Find Short Interest Data?
- What High or Low Short Interest Actually Tells You
- Why Short Interest Numbers Can Mislead You
- A Worked Example: Calculating Days to Cover
- How I Actually Use Short Interest When Sizing Up a Stock
- Combine Sentiment Data With Real Fundamentals
- Sources
What Short Interest Measures and How Short Selling Creates It
To understand short interest, you need to understand the trade behind it. A short sale works in three steps: a trader borrows shares from a broker, sells them immediately at the current price, and later buys them back (ideally cheaper) to return to the lender. The gap between the sale price and the repurchase price is the profit, or the loss if the stock moves the wrong way.
Short interest itself is not a measure of how much short selling activity happened. It's a snapshot of how many of those borrowed shares are still outstanding, meaning they haven't been repurchased yet. FINRA describes it plainly: short interest reflects open short positions at a given point in time, functioning as a gauge of investor sentiment rather than a live trading feed.
You'll typically see it presented two ways:
- Raw share count — the actual number of shares currently sold short.
- Percent of float or shares outstanding — short interest divided by the shares available to trade, which normalizes the number so you can compare a small cap to a mega cap.
How to Calculate the Short Interest Ratio (Days to Cover)
The short interest ratio, better known as days-to-cover, tells you how many trading days it would take for all short sellers to buy back their shares at the stock's average trading pace. The formula is simple:
Short interest ratio = total short interest ÷ average daily trading volume

If a stock has 5 million shares sold short and trades an average of 1 million shares a day, the days-to-cover figure is 5. That means it would take five full trading days of buying, at typical volume, to unwind every open short position.
You can also express short interest as a percentage of float, which tells you a different story: how concentrated the bearish bets are relative to the shares actually available for trading.
- Under 2 days: generally considered low, suggesting shorts could exit quickly without much market disruption
- 2 to 5 days: moderate, a fairly normal range for most actively traded stocks
- 10 or more days: high, and it can point to real difficulty covering positions if buying pressure builds
Statistic to know: analysts commonly treat a days-to-cover ratio above roughly 10 as a warning sign that shorts may struggle to exit cleanly, since unwinding that many positions without moving the price becomes harder as the ratio climbs.
Where Do You Find Short Interest Data?
Short interest isn't reported in real time, and that trips up a lot of beginners expecting a live feed like a stock quote. In the United States, brokerage firms and exchanges report short interest data roughly twice a month, typically around mid-month and month-end.
- FINRA publishes aggregated short interest figures directly from exchange and broker-dealer reporting
- Exchanges (NYSE, Nasdaq) post the same biweekly data through their own market data tools
- Brokers like Schwab and Fidelity typically surface short interest inside their research and screening tools, often pulling from the same underlying reports
Don't confuse this biweekly snapshot with daily short sale volume, which measures trading activity, not open positions. Always check the report date before drawing conclusions.
What High or Low Short Interest Actually Tells You
Short interest is a sentiment gauge, not a crystal ball. A high reading tells you a meaningful chunk of the market is betting against the stock. It does not tell you when, or even if, that bet will pay off. Schwab's investor education material frames it the same way: elevated short interest can signal bearish conviction while simultaneously setting up squeeze risk if sentiment reverses.
Here's how most investors actually put the number to work:
- Screen for stocks with unusually high short interest relative to their sector or history
- Watch percent-of-float alongside days-to-cover, since a high ratio on a thinly traded stock behaves very differently from the same ratio on a heavily traded one
- Use short interest to confirm a thesis you already have from fundamentals, rather than as a standalone buy or sell trigger
Pro Tip: Cross-check short interest against a company's actual financial health before assuming the crowd is right. A stock can carry high short interest for good reason (weak earnings, poor interest coverage) or for reasons that have nothing to do with the business, like index rebalancing or sector-wide pessimism.
Why Short Interest Numbers Can Mislead You
The single biggest pitfall is timing. Because short interest is only reported twice a month, the number you're looking at today could already be stale by the time you act on it. A lot can change for a stock in two weeks.
The second pitfall is mixing up short sale volume with short interest. They sound similar but measure completely different things.
- Short sale volume = daily trading activity involving short sales
- Short interest = the running total of shares still sold short and not covered
There's a subtler trap too. A sudden spike in average trading volume can mathematically shrink the days-to-cover ratio even if the actual number of short positions hasn't moved at all. Analysts warn this volume sensitivity can make a stock look like squeeze risk has dropped when really, more shares are just changing hands.
A Worked Example: Calculating Days to Cover
Say a company has 8 million shares sold short, and its average daily trading volume over the past month is 2 million shares.
- Divide: 8,000,000 ÷ 2,000,000 = 4
- Result: a days-to-cover ratio of 4, which lands in the moderate range
- Interpret: this isn't extreme, but it's worth checking the stock's percent of float, recent news, and whether volume has been unusually high or low lately
Use this same three-step process on any ticker you're researching. It takes under a minute once you have the two numbers.
How I Actually Use Short Interest When Sizing Up a Stock
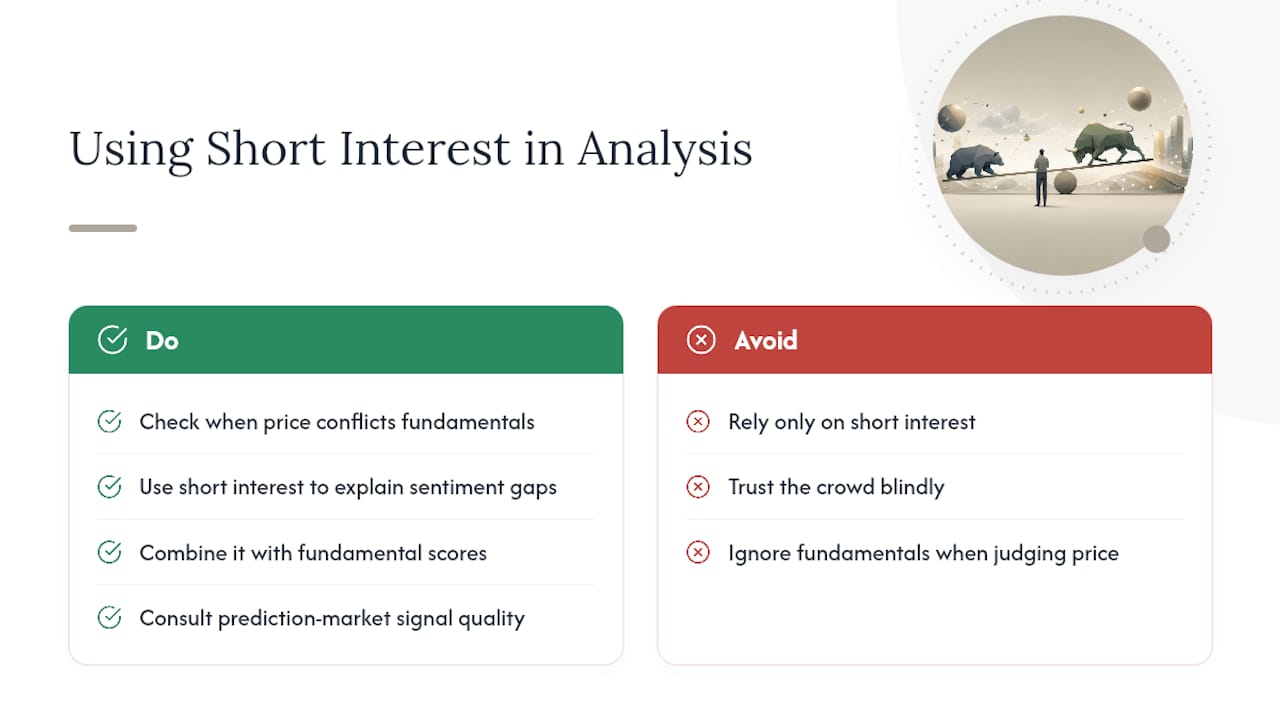
I check short interest when a stock's price action doesn't match its fundamentals. If a company looks financially sound but keeps drifting lower, elevated short interest often explains the gap between the numbers and the market's mood.
Oracle Investments pairs that kind of sentiment context with fundamental scoring, so you're never reading one signal in isolation; for a deeper understanding, see this prediction market signal quality framework. Matt has spent years studying value investing frameworks and believes the crowd is worth watching, just never worth trusting blindly.
— Matt
Combine Sentiment Data With Real Fundamentals
Short interest tells you what the crowd is betting. It doesn't tell you whether the company deserves that bet. Oracle Investments closes that gap by scoring more than 260 stocks on profitability, valuation, and financial health, so you can see whether high short interest lines up with genuine weakness or just noisy sentiment.

The app's real-time portfolio tracking and instant side-by-side comparisons let you check a stock's short interest trend against its actual numbers in one place, instead of juggling a broker screen and a separate research tab. It also folds in principles from investors like Warren Buffett and Peter Lynch, so you're not just staring at a ratio, you're weighing it against a framework built for finding undervalued companies. If a stock has caught your attention because of its short interest, run it through Oracle Investments and see how it actually scores on fundamentals before you make a move.
Sources
This article is general information, not a substitute for advice from a qualified financial advisor. Consult a qualified financial professional about your own circumstances before acting on anything here.