
Stocks are not a reliable inflation hedge across the board. Broad market indices have shown little consistent link to consumer prices over long stretches, but a narrower set of businesses, namely those in commodity-linked sectors, companies with real pricing power, and disciplined dividend growers, have historically held up better over multi-year periods. Selection and holding period matter more than owning "the market" and hoping. Pairing the right equities with instruments like TIPS or a modest commodities allocation tends to work better than relying on stocks alone.
TL;DR:
- Investing in commodity-linked sectors like energy and materials offers the most reliable long-term inflation hedge due to their direct pass-through of rising input costs.
- Companies with strong pricing power, low margin volatility, and a history of dividend growth can better preserve value during inflationary periods.
- Broad market indices generally lack a dependable inflation hedge, but targeted sector or stock selection combined with long holding periods can provide meaningful protection.
- Combining stocks with TIPS, small commodities allocations, and REITs enhances inflation resilience across different economic scenarios and inflation drivers.
- Effective inflation hedging requires careful allocation, long-term rebalancing, and using screening tools that assess fundamentals like margin stability, leverage, and revenue correlation to inflation.
Table of Contents
- Which Sectors Historically Act as Inflation Hedges Stocks?
- What Does the Research Actually Say About Stocks and Inflation?
- How Do You Pick Individual Stocks for Inflation Protection?
- How Should Inflation-Sensitive Stocks Fit Into a Portfolio?
- What Are the Best Alternatives to Stocks for Inflation Protection?
- How Does a Stock-Screening Tool Apply These Criteria?
- A Practical Note on Tradeoffs
- Screen for Inflation-Resilient Stocks Without the Guesswork
- Sources
Which Sectors Historically Act as Inflation Hedges Stocks?
Not every sector responds to rising prices the same way. Some businesses get squeezed as costs climb faster than what they can charge customers. Others turn inflation into a tailwind. Knowing the difference is the entire game.
Energy and materials companies benefit most directly. When inflation is driven by rising commodity prices, oil producers, miners, and chemical companies often see their revenue climb in step with the same input costs squeezing everyone else. A barrel of oil selling for more money flows straight into an energy company's top line. This is the most mechanical, least debatable link between inflation and stock performance, and it's a big reason why Columbia Business School's working paper found meaningfully positive long-run inflation betas concentrated in energy and industrial names.
Consumer staples and branded goods companies rely on pricing power, not commodity exposure. A company selling toothpaste, laundry detergent, or packaged snacks doesn't benefit from higher input costs. It survives them by raising shelf prices without losing customers. Brands with genuine loyalty, think products people buy on autopilot, can push through price increases that would sink a weaker competitor. Warren Buffett has long argued that this kind of pricing power is the single most useful trait to look for in an inflationary environment, and it's a heuristic worth taking seriously.
Industrials and select industrial suppliers occupy a middle ground. Companies that manufacture equipment, provide specialized components, or supply infrastructure materials often have contract structures that let them index prices to inflation or pass through cost increases with a lag. The lag matters. It means industrials can look painful in the short run and still come out ahead over a three or five year window.
Dividend payers and REITs offer a different mechanism entirely: rising income streams. A company that grows its dividend by 6% to 8% annually is effectively giving shareholders a raise that can outpace inflation, assuming the payout is funded by real earnings growth rather than financial engineering. REITs add a layer of built-in inflation linkage because many commercial leases include escalation clauses tied to inflation or fixed annual bumps, letting rental income climb even when the broader economy is under pressure.
Here's the sector map in practical terms:
- Energy and materials: direct commodity-price pass-through, most mechanical link to inflation
- Consumer staples: pricing power lets companies raise prices without losing volume
- Select industrials: contractual price indexing, though often with a lag
- Dividend growers: rising payouts can outrun inflation if funded by real earnings
- REITs: lease escalation clauses provide built-in rent increases in many subsectors
The caveat that gets lost in most of these discussions: sector performance depends heavily on what's actually causing the inflation. Demand-driven inflation in a strong economy treats these sectors very differently than supply-shock inflation triggered by, say, an energy crisis. A screening approach that ignores the macro backdrop is incomplete no matter how good the underlying company fundamentals look.
What Does the Research Actually Say About Stocks and Inflation?
The academic literature on this topic is more skeptical of stocks-as-hedge than most financial media coverage suggests, and the gap between the two is worth understanding before you build a strategy around it.
Inflation beta measures how sensitive a stock's returns are to changes in the inflation rate. A beta of 1.0 would mean a stock's returns move in lockstep with inflation. A negative beta means the stock tends to lose value when inflation rises. Most individual stocks and the aggregate market sit somewhere between mildly negative and roughly zero in the short run, which is the opposite of what a lot of investors assume going in.
The relationship between stocks and inflation isn't fixed. It shifts by time horizon, by economic regime, and by which specific companies or sectors you're measuring, which is exactly why blanket claims about "stocks as an inflation hedge" fall apart under scrutiny.
The Columbia Business School research found that aggregate equity markets often show statistically insignificant correlation with consumer price inflation over long stretches. That's the headline finding most people miss: the S&P 500 as a whole isn't a dependable inflation hedge. But the same research identified a subset of individual stocks, concentrated in energy and industrials, with significantly positive long-run inflation betas. The hedge exists. It's just not evenly distributed across the market.
A separate long-run portfolio analysis published in Journal of Economics and Business reinforces this pattern using cointegration methods, a statistical technique for identifying stable long-term relationships between variables. The study found that specific stocks and sector portfolios show meaningful inflation-hedging properties, but the strength of that relationship varies by holding period and rebalancing frequency. Test the same stocks over a one-year window versus a five-year window and you'll often get different answers about whether they're hedging anything at all.
Statistic callout: Short-run studies frequently find a negative relationship between inflation and stock returns, while long-run analyses of the same data can flip to positive for specific stocks and sectors. The direction of the finding depends almost entirely on the time horizon you choose to measure.
The CFA Institute has been blunt about this, warning investors against treating equities as a universal inflation hedge and suggesting complementary approaches like trend-following strategies or commodities-focused funds for investors who want more direct protection.
The practical takeaway isn't that stocks are useless against inflation. It's that broad exposure isn't the tool. Selection within specific sectors, combined with a long enough holding period to let the relationship play out, is what the evidence actually supports. Anyone screening for inflation resistant stocks needs to accept that the effect shows up over years, not quarters, and that time variation in inflation regimes means yesterday's winning sector isn't guaranteed to repeat.
How Do You Pick Individual Stocks for Inflation Protection?
Turning the research into an actual stock list requires a set of criteria you can measure, not just a sector you like the sound of. Here's a screening framework that reflects what the evidence supports.
- Pricing power. Look for companies that have raised prices in the past three to five years without a corresponding drop in unit sales volume. Gross margin stability during periods of rising input costs is the clearest quantitative signal, if margins held or expanded while commodity costs rose, that's pricing power in action.
- Margin stability over time. Screen for low gross margin volatility, ideally a standard deviation under a few percentage points across the past five to ten years, which suggests the business can defend its cost structure through multiple economic cycles.
- Dividend track record. Favor companies with a documented history of dividend increases, not just a high current yield. A 10+ year streak of dividend growth, paired with a payout ratio below roughly 75%, suggests the dividend is funded by earnings rather than debt.
- Commodity price correlation. For energy, materials, and industrial names, check historical revenue sensitivity to the relevant commodity. A company whose revenue moves with oil, copper, or agricultural prices is getting a more direct inflation link than one relying purely on pricing power.
- Conservative leverage. Screen for interest coverage ratios (operating income divided by interest expense) above roughly 5x, and avoid companies carrying heavy variable-rate debt, since rising inflation often arrives alongside rising interest rates that can crush thinly covered borrowers.
Rank your shortlist by total score rather than picking the highest single metric, since a stock that dominates on yield but fails on leverage is a trap, not a hedge.*
Two behavioral guardrails matter here. First, an unsustainably high dividend yield, anything that looks meaningfully out of line with sector peers, is usually a warning sign that the market expects a cut, not a gift. Second, cyclical companies with weak balance sheets can look like inflation beneficiaries in the short run while carrying the debt load that sinks them the moment rates rise or demand softens. Tools that assess return on equity and margin stability side by side can help separate durable operators from names riding a temporary commodity spike.
How Should Inflation-Sensitive Stocks Fit Into a Portfolio?
Owning the right stocks is only half the job. How much you allocate, how long you hold, and how you rebalance determine whether the hedge actually shows up in your returns.
A reasonable starting range for inflation-sensitive equities, energy, materials, select industrials, and quality dividend growers combined is modest within a diversified equity allocation for investors specifically concerned about inflation risk. That's illustrative, not a formula, and it should flex based on your broader goals and time horizon. Going heavier than that starts to concentrate risk in a way that undermines the diversification benefits you're trying to preserve in the first place.
Rebalancing horizon matters more than most investors assume. The long-run portfolio research found that hedging strength varies with holding period, and generally improves over multi-year windows rather than short-term trading cycles. That argues for a rebalancing cadence measured in years, not months, when you're specifically targeting inflation protection. Chasing whichever sector performed best last quarter defeats the purpose.
Risk controls should include:
- Position sizing that caps any single inflation-hedge stock at a modest percentage of total portfolio value, so one commodity downturn doesn't wreck the plan.
- Tax awareness, since dividend income and short-term rebalancing trades carry different tax treatment, and unnecessary turnover erodes the hedge's net benefit.
- Cost management, favoring low-turnover strategies over frequent trading that racks up fees and taxes without improving the hedge.
- A stated review interval (annually is common) rather than reactive selling every time inflation headlines spike.
A useful illustrative blend for an investor building this out from scratch: a core allocation of quality inflation-sensitive equities, a TIPS allocation sized to offset a meaningful portion of near-term inflation risk to fixed income, and a small commodities sleeve, often single digits as a percentage of the portfolio, for the sharpest, most immediate inflation spikes that equities respond to more slowly. This mirrors the broader downside protection thinking that governs risk management generally: no single instrument should carry the whole job.
What Are the Best Alternatives to Stocks for Inflation Protection?
Stocks shouldn't be the only tool in the box, and the strongest inflation protection usually comes from combining a few instruments rather than betting everything on equity selection.
- TIPS (Treasury Inflation-Protected Securities) adjust their principal value directly based on CPI, giving investors the most direct, contractual inflation link available in a mainstream fixed-income instrument. The tradeoff is duration risk: longer-dated TIPS can still lose value if real interest rates rise, even while their inflation adjustment is working as intended.
- Commodities offer the fastest, most direct exposure to the price increases driving inflation in the first place, but they're volatile enough that most guidance, including recent Forbes coverage on investing during inflation, recommends keeping the allocation small relative to the rest of the portfolio.
- REITs and other real assets provide rental income streams that often carry built-in escalation clauses, giving certain subsectors, industrial and residential in particular, a structural edge during inflationary periods.
- Cash loses purchasing power during inflation almost by definition, but it still plays a role as dry powder for rebalancing into the assets above when opportunities appear.
A multi-instrument approach beats relying on any single asset class, largely because each one responds to a different part of the inflation picture, commodity-driven, rate-driven, or income-driven, and stacking them reduces the odds that one blind spot sinks the whole plan.
How Does a Stock-Screening Tool Apply These Criteria?
Turning this framework into an actual watchlist means running the numbers on profitability, valuation, and financial health for dozens of candidates at once, which is tedious to do by hand. Oracle Investments scores over 260 stocks against those exact fundamentals, letting you filter for margin stability, dividend sustainability, and conservative leverage side by side. A practical workflow looks like this: set your criteria, run the screen, review dividend history and interest coverage on the shortlist, then apply your own qualitative judgment before buying anything. Treat it as a research starting point, not a substitute for due diligence.
A Practical Note on Tradeoffs
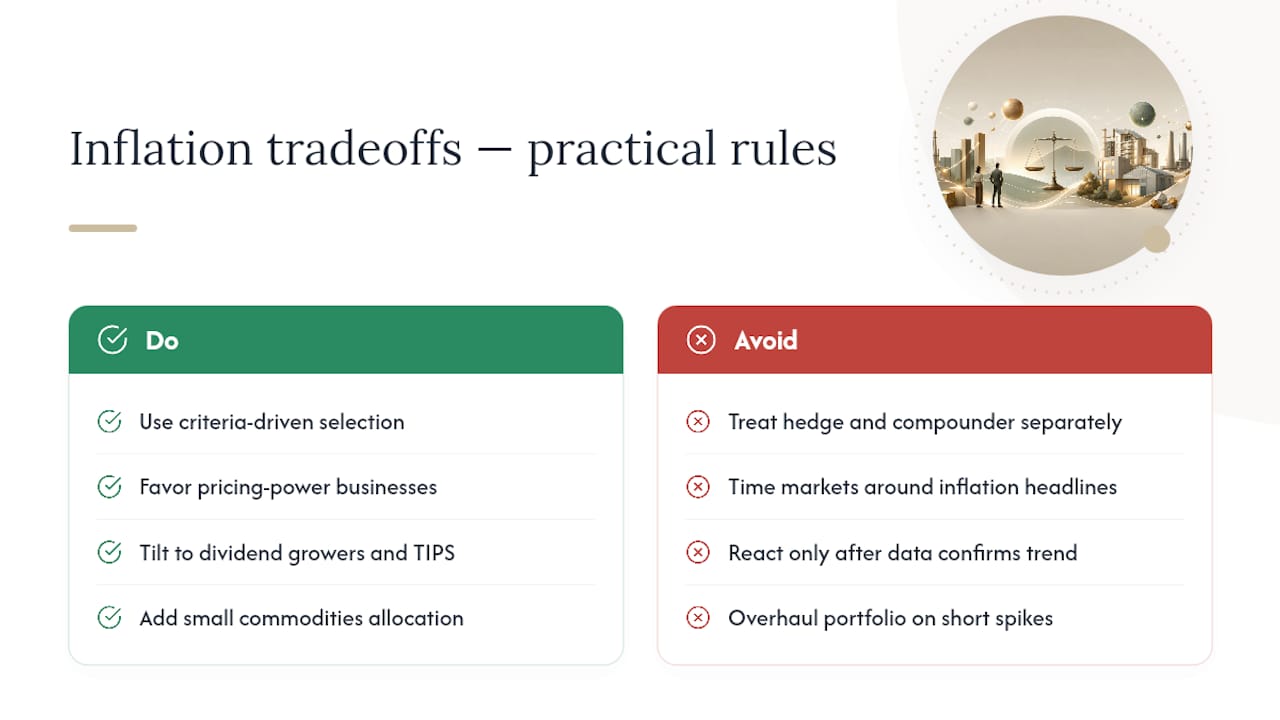
Chasing inflation protection doesn't require giving up on growth. The mistake I see most often is investors treating "inflation hedge" and "long-term compounder" as separate buckets, when the best candidates, pricing-power businesses with clean balance sheets, usually satisfy both goals at once.
Stick to criteria-driven selection. Market timing around inflation headlines rarely works, because by the time inflation data confirms a trend, the stocks that benefit have often already repriced. I lean harder into dividend growers, TIPS, and a small commodities allocation specifically when valuations on the growth side of my portfolio look stretched, not because inflation itself spiked, but because that's when the tradeoff between protection and upside gets genuinely attractive.
— Matt
Screen for Inflation-Resilient Stocks Without the Guesswork
Running the criteria in this article by hand, margin volatility, dividend sustainability, leverage, commodity correlation, across dozens of candidates takes real time most individual investors don't have. Oracle Investments scores over 260 stocks on profitability, valuation, and financial health, so you can filter for pricing power and dividend durability in a single comparison view instead of pulling ten-year financials one ticker at a time.

The app also layers in investing principles from Warren Buffett, Charlie Munger, and Peter Lynch, giving you context for why a stock scored the way it did, not just a raw number. If you're building an inflation-focused watchlist, start comparing stocks with Oracle and shortlist candidates against the fundamentals that actually matter. This is a research and screening tool meant to support your own analysis, not personalized financial advice.
Sources
- Inflation and stock returns (Columbia Business School working paper)
- Hedging inflation with individual US stocks: A long-run portfolio analysis (ScienceDirect)
- Myth-Busting: Equities Are an Inflation Hedge (CFA Institute)
- TreasuryDirect — TIPS (TreasuryDirect)