
Discounted cash flow is a valuation method that estimates what an investment is worth today by projecting its future cash flows and discounting them back to the present using a required rate of return. It works because a dollar next year is worth less than a dollar in your pocket right now, and DCF puts a precise number on that gap.
Use DCF when you're valuing a business, a long-lived project, or a bond where cash flows can be reasonably forecast years into the future. Skip it, or at least pair it with something faster, when you need a quick read on a stock and a peer multiple will do, or when the company is too young to have predictable cash flows at all.
- Use DCF for: mature companies, infrastructure projects, real estate, bonds, and any asset where cash generation is the core value driver.
- Skip or supplement with comps for: early-stage startups, pre-revenue biotech, or fast gut-check comparisons across a sector.
- Core inputs that drive everything: free cash flow forecasts, a discount rate like WACC, and a terminal value assumption.
Get those three inputs wrong and the DCF output is wrong, no matter how elegant the spreadsheet looks. That single fact explains most of what follows in this guide, and it's the reason tools like Oracle Investments exist to sanity check the numbers analysts pull out of thin air.
Key Takeaways
A discounted cash flow model is only as reliable as the consistency between its cash flows, discount rate, and terminal value assumptions.
| Point | Details |
|---|---|
| DCF is intrinsic, not relative | It values a business on its own cash generation, independent of peer trading multiples. |
| Match cash flows to discount rates | Use WACC with FCFF, or cost of equity with FCFE, never crossed. |
| Terminal value dominates | It often represents the majority of total value, so test it harder than any other input. |
| Sensitivity beats point estimates | A one-point shift in the discount rate can move per-share value by roughly 20%. |
| Pair modeling with a fundamentals check | Oracle Investments scores 260-plus stocks on cash flow and valuation signals to cross-check your DCF output. |
Table of Contents
- What Does DCF Actually Measure?
- What Are the Five Steps of a DCF?
- How Do You Build a DCF Model Step by Step?
- Worked Example: A Five-Year DCF From Revenue to Per-Share Value
- What Mistakes Wreck Most DCF Models?
- When Should You Trust a DCF, and When Should You Not?
- DCF Cheat Sheet: Quick Rules and Excel Formulas
- Key DCF Terms You Need to Know
- Frequently Asked Questions
- Sources
What Does DCF Actually Measure?
Picture $100 sitting in a savings account earning 5% a year. That $100 becomes $105 in twelve months. Flip that around: $105 received a year from now is worth exactly $100 today, if 5% is your required return. That's present value, and it's the entire engine behind discounted cash flow analysis. You're not predicting stock prices. You're estimating the cash a business will generate over its life and translating every future dollar into today's dollars.
This is what makes DCF an intrinsic valuation method rather than a relative one. Relative valuation, the kind that uses price to earnings ratios or EV to EBITDA multiples, tells you what a company is worth compared to its peers. DCF ignores peers entirely and asks a different question: based on this company's own cash generation, what should it be worth on its own terms?
The two approaches often disagree, and that disagreement is useful information. If your DCF says a stock is worth $40 but the market and its peers are pricing it at $65, you either found something the market missed or your assumptions are off. Both are worth investigating.
DCF earns its keep with businesses that have long histories, stable margins, and cash flows you can actually forecast with some confidence. It struggles with pre-revenue startups, cyclical commodity producers in a downturn, and any company where next year's cash flow is genuinely a coin flip. Forcing a DCF onto a company with no earnings history just dresses up a guess in decimal points.
What Are the Five Steps of a DCF?
Every DCF, from a first-year analyst's homework to a hedge fund's live model, follows the same five-step sequence. Memorize this order before you open Excel.
- Forecast future cash flows. Project revenue, margins, and reinvestment needs for an explicit period, usually five years, to arrive at free cash flow for each year.
- Choose your discount rate. Pick WACC if you're forecasting cash flows to the whole firm, or cost of equity if you're forecasting cash flows to shareholders only.
- Estimate terminal value. Capture everything beyond your forecast window with either a perpetuity growth formula or an exit multiple.
- Discount every cash flow to today. Divide each year's cash flow, including the terminal value, by (1 + discount rate) raised to the power of that year.
- Sum the present values. Add everything up to get enterprise value, then adjust for debt and cash to land on equity value.
The two decision points that trip up most beginners sit at steps one and two: FCFF versus FCFE, and WACC versus cost of equity. Mismatch those and every number downstream is quietly biased, a point Damodaran has hammered on for decades. Get the pairing right and the rest of the model is mechanical.
How Do You Build a DCF Model Step by Step?
Building the model means making a handful of explicit choices and running the same formula on repeat. Here's where most of the actual work happens.
FCFF or FCFE: which cash flow should you forecast?
Free cash flow to the firm (FCFF) represents cash available to everyone who financed the business, debt holders and shareholders alike. Free cash flow to equity (FCFE) strips out debt holders and shows what's left for shareholders after debt payments.
FCFF starts with net operating profit after tax (NOPAT): operating income times (1 minus the tax rate). From there, add back depreciation and amortization, subtract capital expenditures, and subtract the increase in net working capital. FCFE takes FCFF and adjusts further for net borrowing, subtracting debt repayments and adding new debt issued.
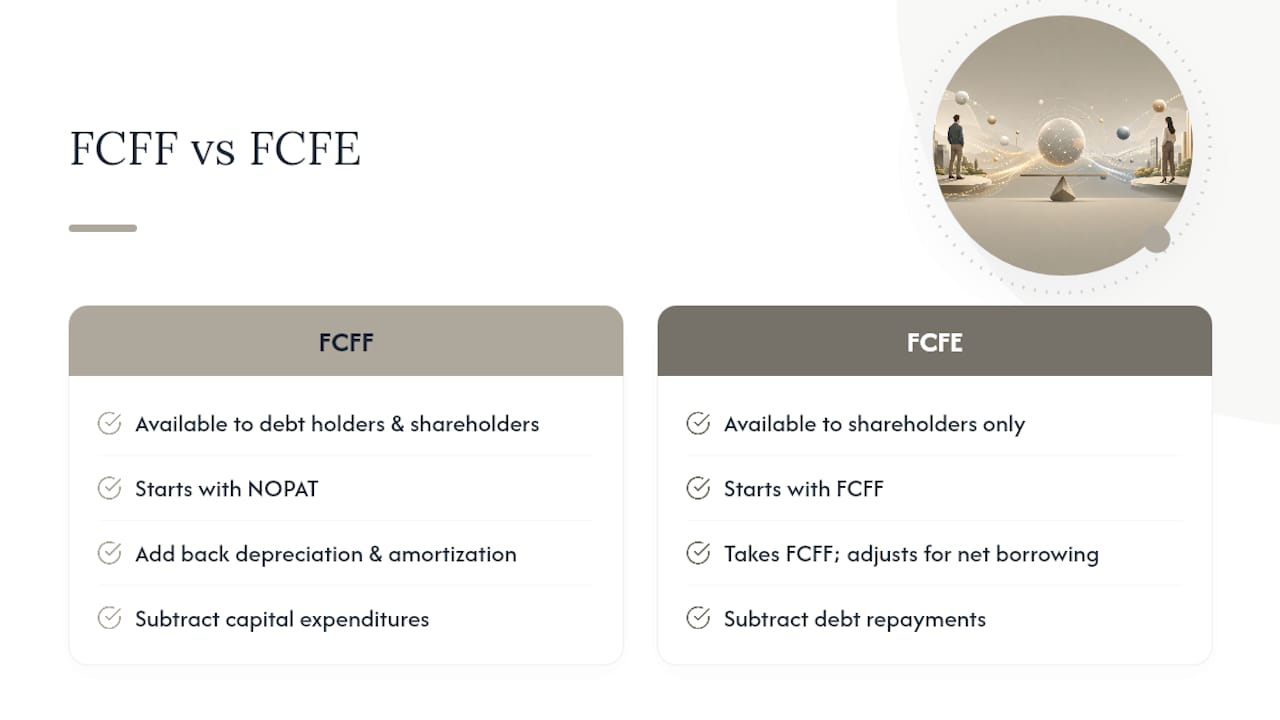
Most equity research defaults to FCFF paired with WACC because it sidesteps the messiness of forecasting a company's future borrowing decisions. FCFE paired with cost of equity works better for banks and financial firms, where debt is a raw material rather than a financing choice.
How do you calculate the discount rate?
WACC blends the cost of debt and the cost of equity, weighted by their market values, not their book values. The formula: (E/V × cost of equity) + (D/V × cost of debt × (1 − tax rate)), where E is market value of equity, D is market value of debt, and V is E plus D.
Cost of equity almost always comes from the Capital Asset Pricing Model (CAPM): risk-free rate plus beta times the market risk premium. The risk-free rate typically tracks the 10-year Treasury yield. Beta measures how volatile the stock is relative to the market, and you can pull it from most brokerage platforms or calculate it yourself from historical returns. The market risk premium, the extra return investors demand for holding stocks over bonds, usually runs somewhere in the 4% to 6% range historically, though reasonable analysts disagree on the exact figure.
- FCFF discounted at WACC gets you enterprise value.
- FCFE discounted at cost of equity gets you equity value directly, no debt adjustment needed afterward.
- Never cross the streams: WACC on equity cash flows or cost of equity on firm cash flows both introduce systematic bias, one pushing value up, the other pushing it down.
How do you estimate terminal value?
Your explicit forecast can't run forever, so terminal value captures every year beyond it. Two methods dominate.
Perpetuity growth (Gordon growth) method: Terminal Value = Final Year Cash Flow × (1 + g) / (Discount Rate − g), where g is a long-term growth rate that should never exceed the long-run growth rate of the overall economy, typically somewhere near 2% to 3%.
Exit multiple method: Terminal Value = Final Year EBITDA × an industry-appropriate exit multiple, pulled from comparable company trading data.
The perpetuity method feels more theoretically pure since it's built entirely from your own model's logic. The exit multiple method grounds your terminal value in what the market actually pays for similar businesses, which guards against wildly optimistic growth assumptions sneaking in unnoticed. Strong analysts run both and check that they roughly agree.
Pro Tip: *Before you trust any DCF output, check that the implied exit multiple from your perpetuity growth calculation lands somewhere reasonable next to real trading multiples in the sector.
Terminal value routinely makes up more than half of total DCF value, sometimes far more, which is exactly why the assumptions behind it deserve more scrutiny than any other single input in the model. Get the terminal value wrong and it barely matters how careful you were with years one through five.

For inputs, a five-year explicit horizon is standard for most operating businesses, long enough to capture a normalization cycle without pretending you can forecast a decade out with any precision. Match your reinvestment rate to your growth assumption.
In Excel, the mechanics are simple once the inputs are set. A discount factor for year t is =1/(1+r)^t. Multiply that by each year's forecast cash flow to get present value. For a full model with equal annual periods, =NPV(rate, cash_flow_range) sums the discounted values in one step, though it discounts the first cash flow by one full period, so line up your ranges carefully. If cash flows land on irregular dates, =XNPV(rate, cash_flows, dates) handles that precisely instead of forcing everything into clean annual buckets.
Worked Example: A Five-Year DCF From Revenue to Per-Share Value
Here's a simplified model for a hypothetical mid-cap company to show every moving part in one place. Figures are illustrative, built to demonstrate the mechanics rather than represent any real company.
| Year | Revenue ($M) | Operating Income ($M) | NOPAT ($M) | Capex + ΔWC ($M) | FCFF ($M) | Discount Factor (10%) | Present Value ($M) |
|---|---|---|---|---|---|---|---|
| 1 | 533 | 80.0 | 60.0 | 32.0 | 28.0 | 0.909 | 25.8 |
| 2 | 574 | 86.0 | 64.8 | 35.0 | 30.6 | 0.826 | 25.8 |
| 3 | 623 | 93.5 | 70.4 | 38.4 | 32.7 | 0.751 | 25.6 |
| 4 | 672 | 101.0 | 76.5 | 40.8 | 35.7 | 0.708 | 25.3 |
| 5 | 735 | 110.2 | 82.7 | 44.1 | 38.6 | 0.650 | 25.1 |
Sum the five present values and you get roughly $127.8 million. Discount that back at the Year 5 factor of 0.650 and it contributes roughly $396 million to today's value.
- Enterprise value: $127.8 million (explicit period) + $396 million (discounted terminal value) ≈ $524 million.
- Equity value: subtract $80 million in net debt, leaving about $444 million.
- Per-share value: with 40 million shares outstanding, that's roughly $11.10 per share.
Notice that the terminal value alone accounts for roughly three-quarters of total enterprise value here, which is typical and exactly why sensitivity testing matters more than tweaking your Year 3 margin assumption by half a percent.
| Discount Rate | Terminal Growth 2.0% | Terminal Growth 2.5% | Terminal Growth 3.0% |
|---|---|---|---|
| 8% | $12.85/share | $13.70/share | $14.75/share |
| 9% | $10.40/share | $11.10/share | $11.90/share |
| 10% | $8.60/share | $9.15/share | $9.75/share |
A one-point swing in the discount rate can move per-share value significantly. That's why any DCF handed to you without a sensitivity table deserves a raised eyebrow.
What Mistakes Wreck Most DCF Models?
Most bad DCFs fail for the same handful of reasons, and every one of them is avoidable with a five-minute audit.
- Mismatching cash flows and discount rates. Applying WACC to FCFE, or cost of equity to FCFF, silently biases the output in one direction. This is the exact error Damodaran singles out as the most common and most damaging mistake in practice.
- Letting terminal value dominate without scrutiny. If terminal value is 80% or 90% of total enterprise value, your entire valuation rests on assumptions about a period you can barely forecast.
- Ignoring implied multiples. A perpetuity growth terminal value that implies a 30x EBITDA exit multiple in a sector that trades at 12x is a red flag, not a feature.
- Growth assumptions with no support. A 6% terminal growth rate in an economy growing at 2% is mathematically saying this one company will eventually be larger than the economy that contains it.
Pro Tip: Build your sensitivity table before you fall in love with a single valuation number. A DCF that only makes sense at one exact discount rate and one exact growth rate isn't a valuation, it's a coincidence.
When Should You Trust a DCF, and When Should You Not?
DCF's biggest strength is that it's grounded in actual cash generation rather than accounting earnings, which companies have more room to manipulate through depreciation schedules or one-time charges. It's flexible enough to value stocks, private businesses, real estate, and infrastructure projects with the same underlying logic, and it forces you to write down every assumption explicitly instead of hiding behind a peer multiple.
The tradeoff is sensitivity. Small changes in the discount rate or terminal growth rate swing the output dramatically, and firms without stable, predictable cash flows will produce a DCF that's more fiction than forecast.
- DCF versus NPV: they share the same discounting mechanics, but NPV typically subtracts an initial investment from the sum of discounted cash flows, making it more common for project-level capital decisions.
- DCF versus multiples: relative valuation is faster and anchored to what the market actually pays today; DCF is slower but independent of whether the whole market happens to be overpriced.
A DCF is only as trustworthy as its weakest assumption. Treat the output as a range grounded in logic, never as a single precise number handed down from on high.
DCF Cheat Sheet: Quick Rules and Excel Formulas
Keep this nearby the next time you open a blank spreadsheet.
- Forecast horizon: 5 years is standard for most operating companies; extend to 7 to 10 years for businesses with long investment cycles like utilities or pharma.
- Terminal growth rate: stay near or below long-run GDP growth, generally in the 2% to 3% range.
- WACC for mature, stable companies: commonly falls somewhere between 7% and 12%, depending on capital structure and industry risk.
- Discount factor formula:
=1/(1+rate)^period - Equal-period cash flows:
=NPV(rate, cash_flow_range) - Irregular or date-specific flows:
=XNPV(rate, cash_flows, dates), which is more precise than forcing everything into annual buckets. - Mid-year convention: if cash flows arrive throughout the year rather than at year-end, subtract 0.5 from each period exponent to avoid understating present value.
Lay out your model with one row per year across the top, cash flow components stacked below, and a final present value row that sums cleanly into your enterprise value cell. Simple layouts catch errors faster than clever ones.
Key DCF Terms You Need to Know
A few definitions worth bookmarking as you build your first model:
- FCFF (free cash flow to the firm): cash available to all capital providers, discounted at WACC to get enterprise value.
- FCFE (free cash flow to equity): cash left for shareholders after debt obligations, discounted at cost of equity to get equity value directly.
- WACC: the blended required return across a company's debt and equity financing.
- NOPAT: operating income after tax, before financing effects, the starting point for FCFF.
- Terminal value: the lump-sum value of all cash flows beyond your explicit forecast period.
- Enterprise value: the value of core business operations, before adjusting for debt and cash.
- Equity value: enterprise value minus net debt, the number that maps to a per-share price.
A Practical Note on Trusting the Output
I treat every DCF as an informed estimate dressed up in decimals, never as gospel. Run a base case, then flex growth and the discount rate until you've got a real range, not a single number you're emotionally attached to.
Let a Tool Double-Check Your Assumptions
Building a DCF by hand teaches you the mechanics, but cross-checking your output against a second, independent read is how you catch a bad assumption before it costs you money. Oracle Investments scores more than 260 stocks on profitability, valuation, and financial health, surfacing free cash flow trends and valuation signals side by side so you can sanity check your own model's implied value against a fundamentals-driven score in seconds rather than hours.

It draws on investing frameworks from Warren Buffett, Charlie Munger, and Peter Lynch, and pairs that with real-time portfolio tracking, so the same screen you use to stress-test a DCF also tracks the position once you act on it. It's not a replacement for understanding the five steps in this guide. It's the fastest way to confirm you got them right. Open the Oracle Investments app and run your next valuation call through it before you commit capital.
Frequently Asked Questions
What is the difference between DCF and NPV? DCF calculates the present value of all expected future cash flows from an investment. NPV takes that same discounted sum and subtracts the initial investment cost, which makes NPV the more common metric for evaluating a specific capital project rather than valuing an entire company.
Should I use FCFF or FCFE for stock valuation? Most equity analysts default to FCFF discounted at WACC because it avoids forecasting future borrowing decisions and produces enterprise value first, which you then bridge to equity value. FCFE works better when a company's capital structure is unusually stable or when you're valuing a bank.
How do I handle inflation in a DCF model? Keep your cash flow projections and discount rate on the same basis, either both nominal (including inflation) or both real (excluding it). Mixing a nominal discount rate with real cash flow forecasts overstates present value, the same consistency error Damodaran warns about with cash flows and discount rates generally.
What if the company has significant debt or cash on the balance sheet? Non-operating cash and short-term investments get added to enterprise value when converting to equity value; total debt gets subtracted. Any non-core assets, like a stake in an unrelated business, should be valued separately and added on top, since a DCF built purely from operating cash flow forecasts will not capture them.
How sensitive is DCF to the discount rate? Very. That sensitivity is exactly why every serious DCF ships with a range, not a single number.
This article is general information, not a substitute for advice from a qualified financial advisor. Consult a qualified financial professional about your own circumstances before acting on anything here.